“The primary objective in data visualization is to gain insight into an
information space by mapping
data onto graphical
primitives” ---- Senay and Ignatius
Visualization
Features
From
Pieter W. Groen, Vrije
Universiteit Amsterdam
Glyphs: geometric objects representing -multiple- features of data locally, i.e. on discrete positions. There are degrees of freedom due to size and color. Shape distinguishes different fields, e.g. spheres for a scalar field and arrows for a vector field, or spheres for one scalar field and cubes for the other.
Glyphs: geometric objects representing -multiple- features of data locally, i.e. on discrete positions. There are degrees of freedom due to size and color. Shape distinguishes different fields, e.g. spheres for a scalar field and arrows for a vector field, or spheres for one scalar field and cubes for the other.
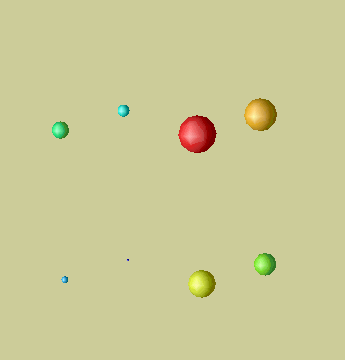
Glyphs for scalar values
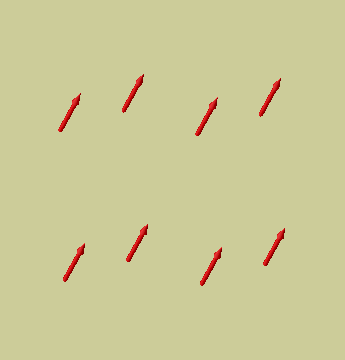
Glyphs for vector values
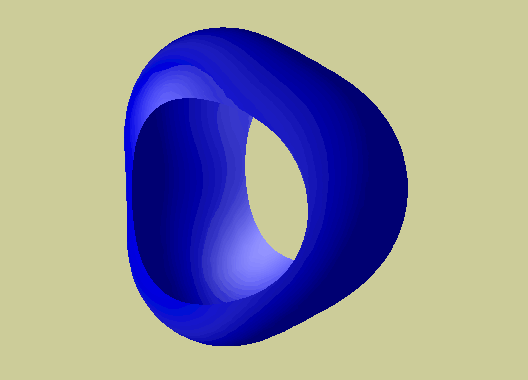
Glyphs for scalar data level-values in two or three dimensions:
- Represent intensities of a density field : a continuum
of values showing some spatial continuity, like the iso-bars or
temperature levels in meteorology.
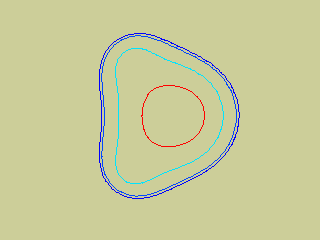
2D: Isocontours
Dynamics: change (over time) in the data values
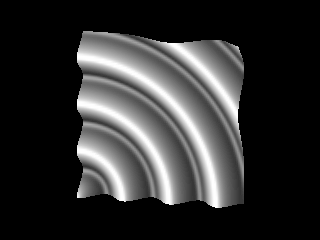
- Rubber sheet: rendering of scalar data as the height of a deformed surface.
- Animation: change of data, position, or whatever as a function of time or another -independent- parameter.
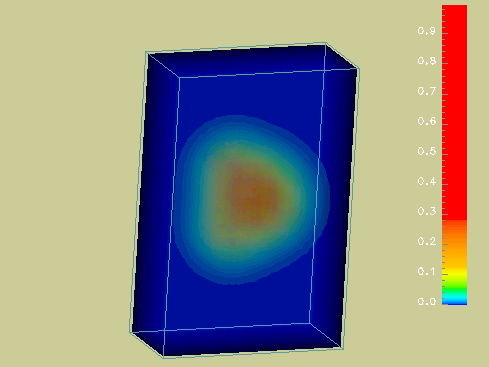
Volume rendering : in
3D show a density field in transparency, or via slices, rather than via
geometry (such as isosurfaces).

Examples in
geographical applications
i.e., for data that can be displayed in a geographical context.
From Jo Wood, Project Argus, 1998
Painting and
Visualization
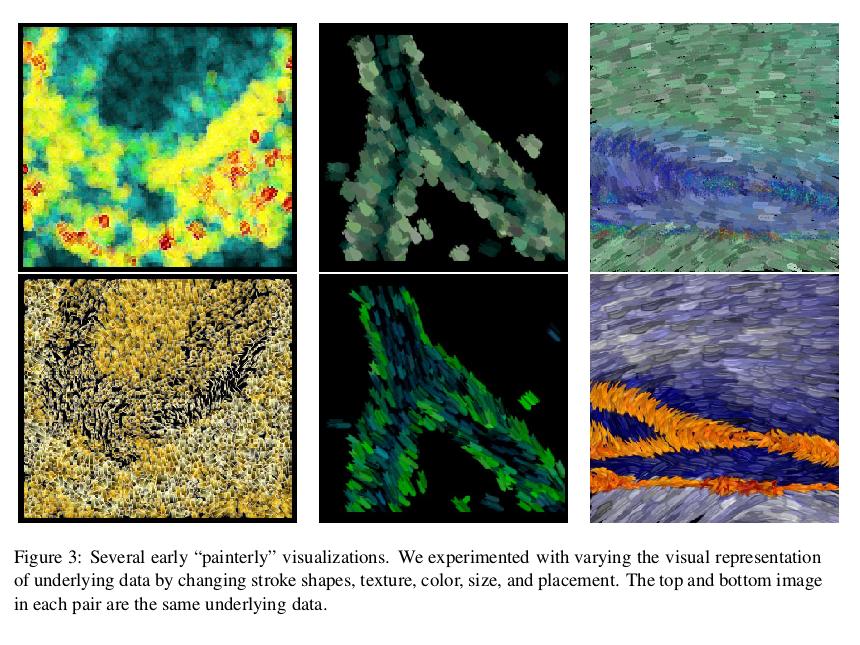
From Kirby, Keefe and Laidlaw,
"Painting and Visualization," 2003.
More examples from Laidlaw and associates

