


Animal Frequencies
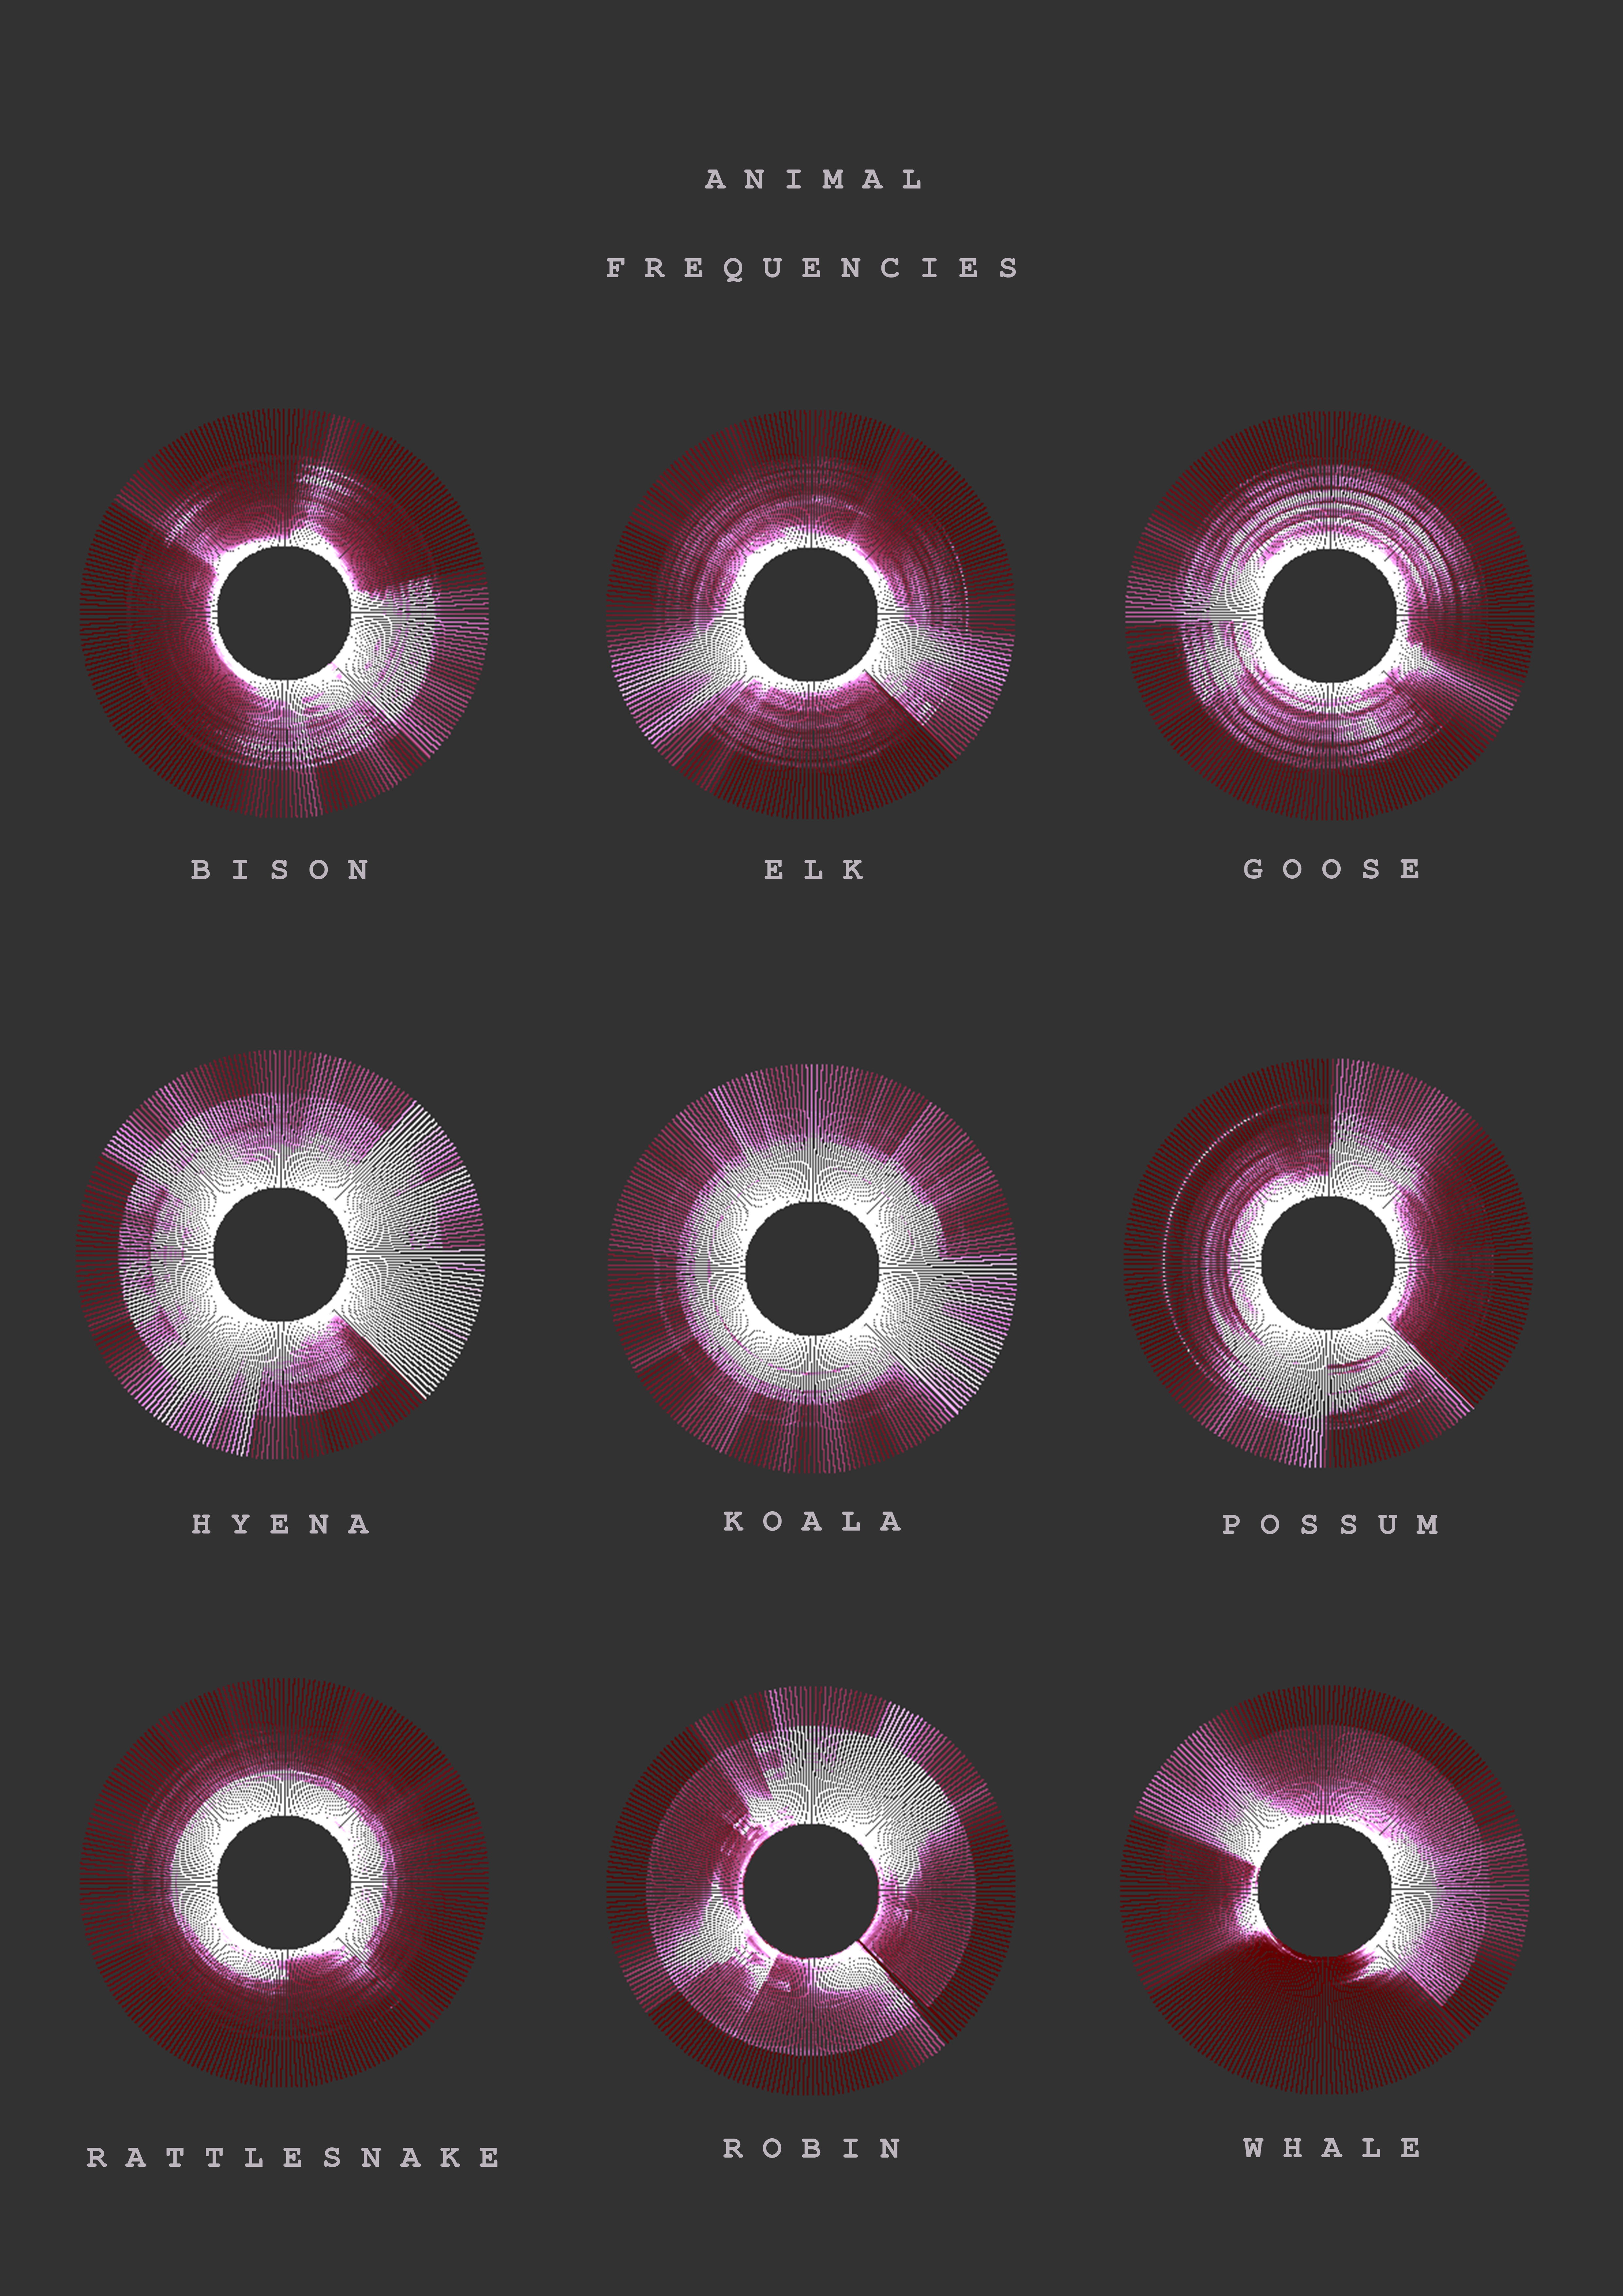
“Animal Frequencies” is a project which visualises the unique voices of nine different species of animals. It aims to demystify animal communication by offering an alternative way of consuming the data of animal sound frequencies which incorporates our sense of sight.
Chloe Karnezis
Concept and background research
Scientists have spent hundreds of years studying animal behaviour and communication, yet the area remains opaque to most of us today. In fact, I believe the "voicelessness" of animals –their inability to communicate with us on our own, human terms– to be one of the leading causes for hunting, farming, and animal cruelty to run rampant today. "Animal Frequencies" is an attempt to bring animal voices back to our attention and broaden our understanding of them. Rather than being a sombre reflection on the state of animal rights today, it is a celebration of the visual, aesthetic value of unique animal sounds as we have rarely seen them.
The data visualisation work of Benedikt Groß and Joey Lee was a big inspiration for "Animal Frequencies". In the past I created a Processing project which visualised noise levels on the London Underground, and when those became dangerous to our hearing. The focus of that work was primarily its functionality and usefulness. The work of Groß and Lee, more specifically their "Big Atlas of LA Pools" (2013), introduced me to a new type of data visualisation– one whose primary focus is aesthetic value and a more abstract representation of issues in our contemporary age. This is the approach I have taken in creating "Animal Frequencies".
In terms of visualising the sound data for this project, I was largely inspired by the work of David Mrugala, who combines visual narratives and natural science studies, sound analysis and data visualization.
Technical
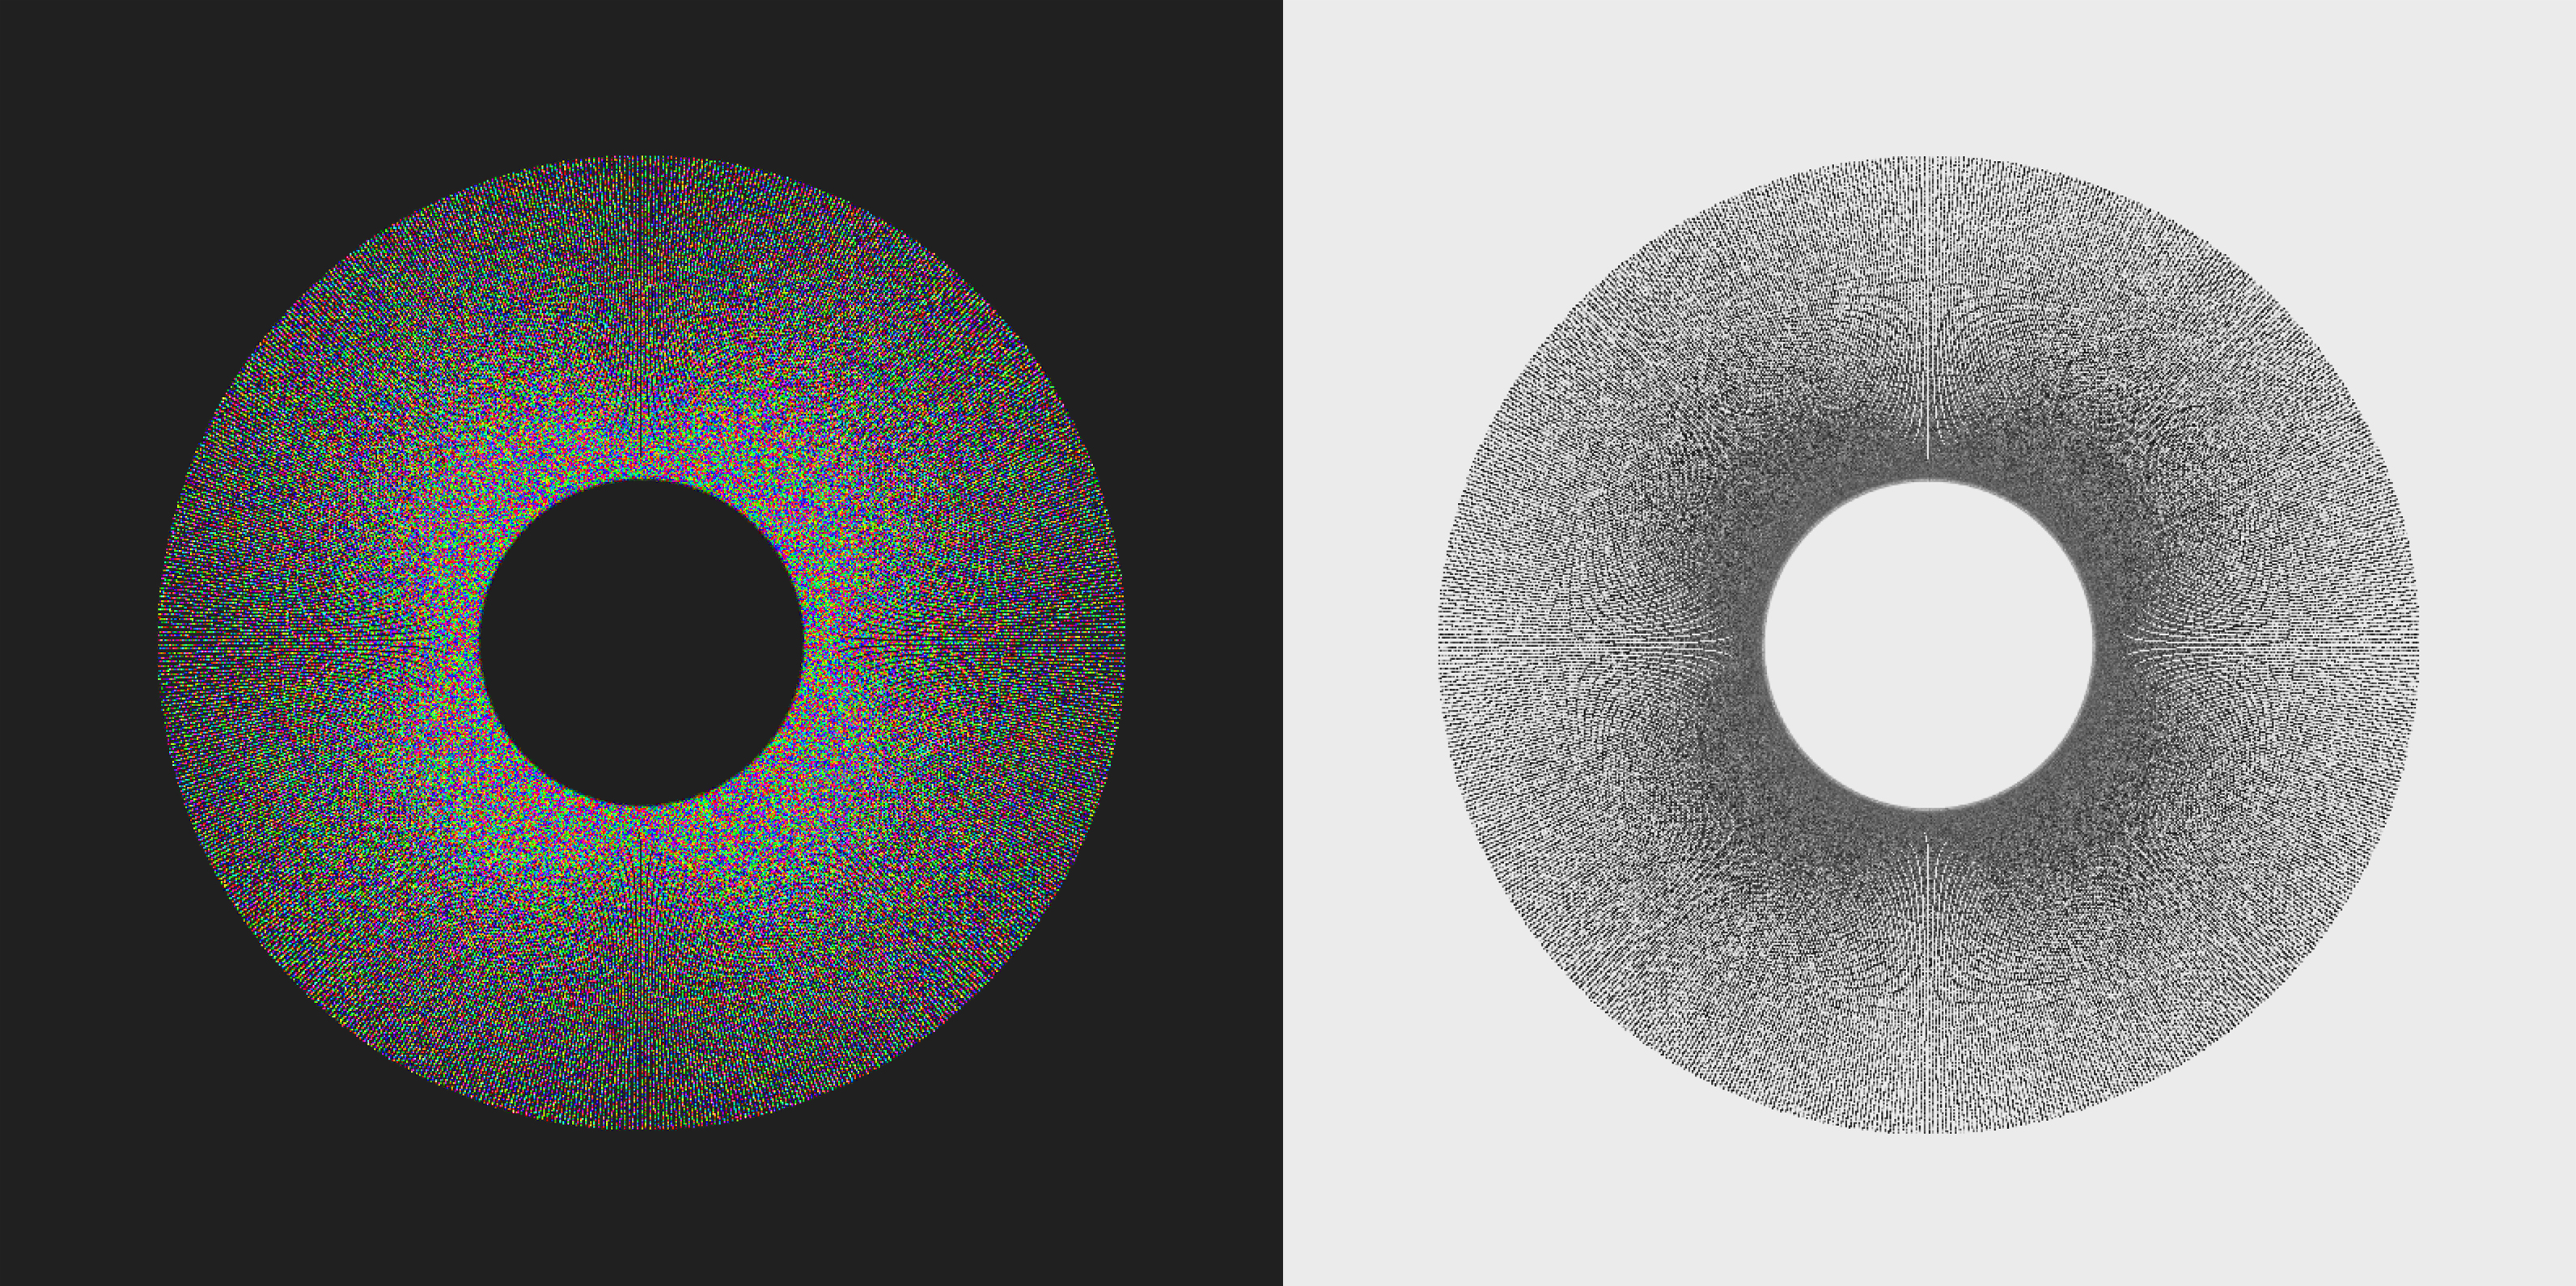
"Animal Frequencies" makes use of the Minim audio library, and more specifically the FFT functionality for sound analysis. I originally planned on creating discs made up of lines whose colour responded to the audio. The result did not, however, offer the amount of detail, visually, which I aspired to for this project.
After experimentation, the "unit" for the discs ended up being "lines" which actually comprised of 10,000 vertices, as opposed to being drawn using the built-in line() function. This change was key to the aesthetic of the sketch as it offered larger flexibility and "sensitivity" when responding to the audio files. Each vertex takes on a different colour according to the audio frequency. From the koala's startlingly baritone growl to the elk's high-pitched shriek, the audios used in this project lend themselves perfectly to the creation of unique visuals, in a way that the human voice does not.
The sketch is interactive: by pressing the allocated keys, the user can switch between sounds as well as generate an "Animal Frequencies" pdf booklet.
Future development
I am interested in the ways in which this project can reach a larger audience, as well as its commercial applications. By collecting more data I too could potentially create "The Big Atlas of Animal Frequencies". The discs could also serve as alternative illustrations in Zoology and animal sciences books. Lastly, I would like to try 3D-printing or engraving the discs in wood. In an engraving scenario, the colour or the discs in different areas would determine the depth of engraving. These wooden discs could go on to serve as decorations or even stools with the addition of wooden legs.