


forTheTide!
An exploration of the complexity and dynamics between the Thames Tide and its inhabitants
produced by: Gerolamo Gnecchi Ruscone
Introduction
“The tidal current runs to and fro in its unceasing service, crowded with memories...it had borne to the rest of home or to the battles of the sea. It had known and served all the men...It had borne all the ships whose names are like jewels flashing in the night of time...It had known the ships and the men...What greatness had not floated on the ebb of that river into the mystery of an unknown earth!”
― Joseph Conrad, Heart of Darkness
How vibrant is the sea represented on old navigation maps? Filled with undefined and over-scaled creatures, ships, and sometimes graphic adventures. Used to navigate, narrate stories, these maps showed, in an imaginary and abstract way, the diversity, the mystical, and the unknown of the water surrounding us.
Today there is still much we do not know about the sea -more than eighty percent of our ocean is unmapped- and sometimes what we know already we take it for granted. Yet we tend to use simple white or blue color to indicate areas of water on maps. We visualize the sea levels and tidal shifts only in height and numbers. By simplifying water to one color or number, we lose the ever-changing, the complexity, yet predictable, that makes us so drawn to it.
forTheTide! aims to challenge our perception and illustrate differently the changes and movements of the Thames river by exploring tidal shifts.
Tidal shifts are the rise and fall of sea levels caused by the combined effects of the gravitational forces exerted by the Moon and the Sun on the rotation of the Earth. The Thames Tide experiences two high and two low tides within a twenty-four hour period.
Concept and background research
The Thames is a sphere of dynamic simultaneity, enriched by new arrivals waiting to be determined by the construction of new relations. It continuously transforms. The currents change direction because of the wind and the gravitational pull of the moon, shaping and affecting what they encounter. From commercial fishers to the Thames Barrier, the river continually alters itself, readapting to our presence, to the artifacts that have been created around this ecosystem.
It is a thriving environment that urges an intimacy with the species that coexist within it — who they are, why they are, and where they do what they do. Only by engaging with these concerns can we, too, play a part in this ecosystem, taking care not to disrupt but rather to contribute to the balance and fluidity. Through this, the Thames becomes our link with the natural and unknown fields of this planet.
It is a mystical river. And we must treat it as such, exploring in more depth the different ways we perceive the Tide to understand it better and create alongside it. When we think of the Tide, we tend to have a clear image: it goes up and down, it shifts between low and high, we see its movements. While this conception is not wrong, it limits our knowledge of the Tide. As Juhani Pallasmaa said, “there is a necessity to detach ourselves from the optical predominance.” Is it possible to detach ourselves from this visual bias and explore the nuance of the Tide from a different perspective?
To explore the Thames transformations during tidal shifts, I built a device, a pendulum. The idea of using a pendulum as an analytical and recording instrument was for the simple purpose it serves: when released, it oscillates freely, and it is subject to the movements of the boat. Depending on the position of the moon and other external factors, the shifting period varies. It is unequal and inconsistent, shaping and affecting what the sea encounters and the oscillation of the pendulum.
The data is then used and sent to an interactive installation where mechanisms will activate the movement of physical elements, which subsequently generate visuals and trigger sounds of the inhabitants that live within the Thames. The artwork will hopefully give a whole new voice and sensorial experience for the Tide!
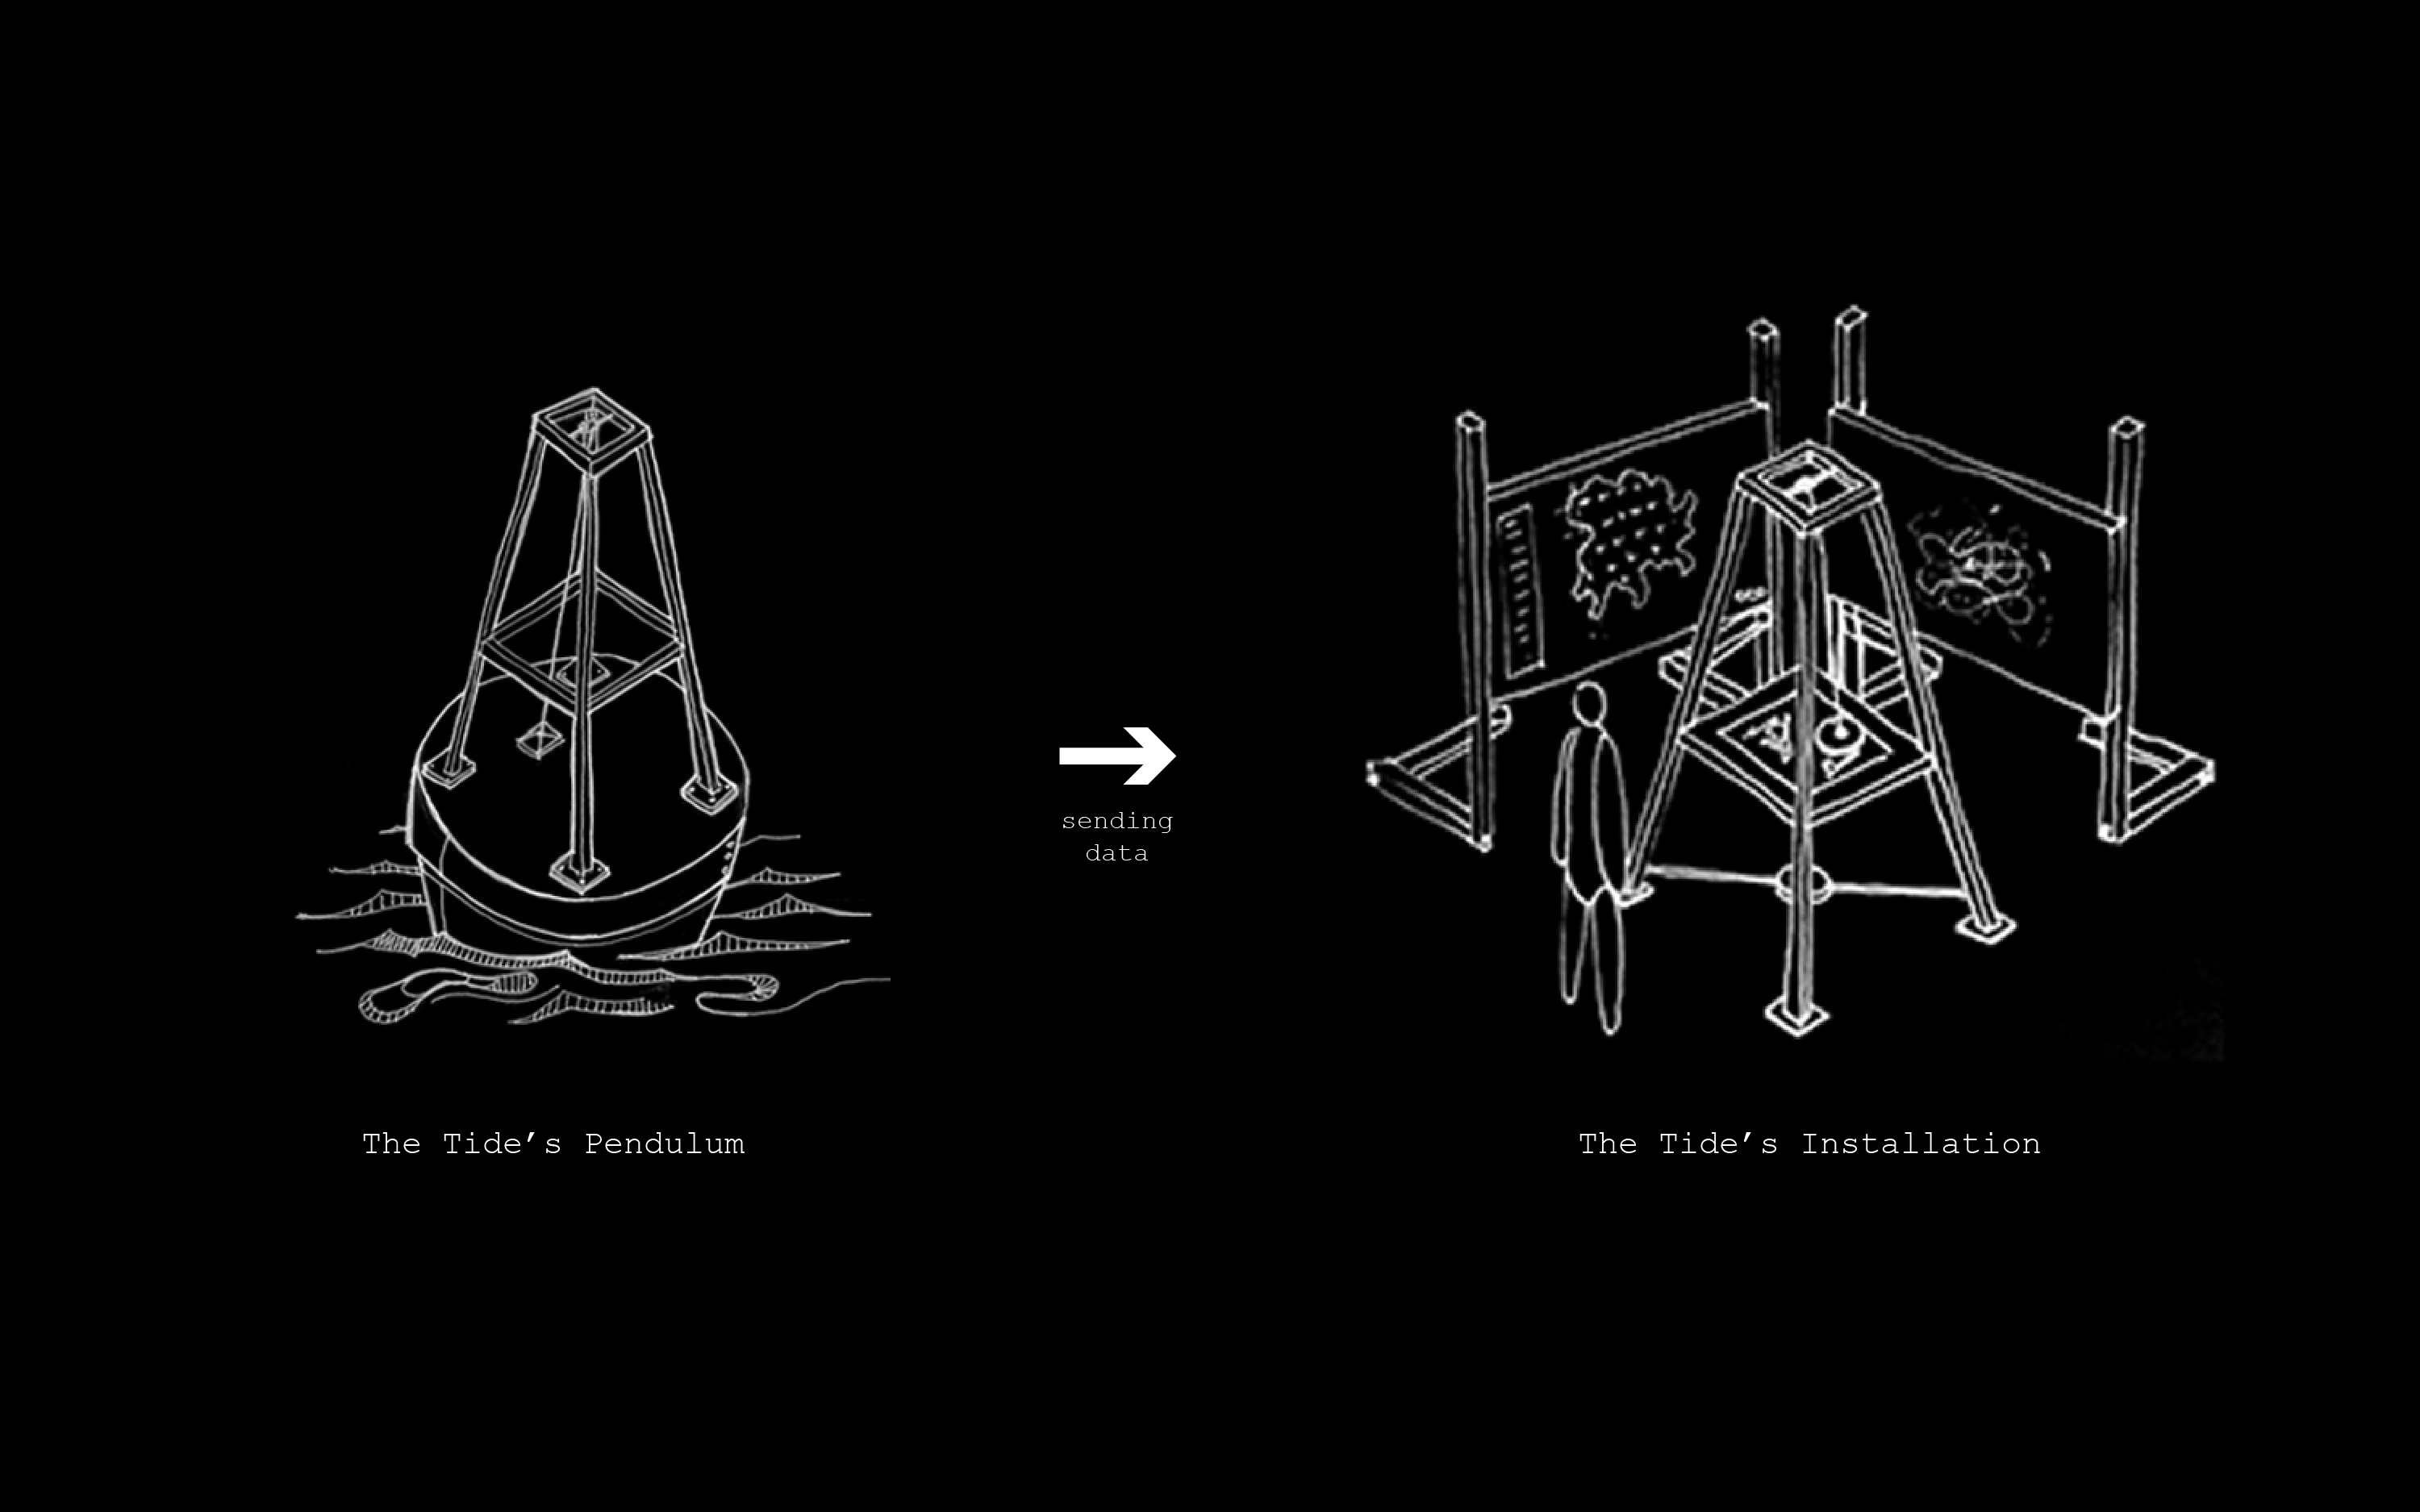
Initial sketch for the project: A floating structure that communicates in real-time with a remote interactive installation
Technical
The project brings together different techniques: from recycling materials to digital fabrication, from field recording to web servers, from physical mechanisms to generative visuals and sounds. forTheTide! is divided into three different parts:
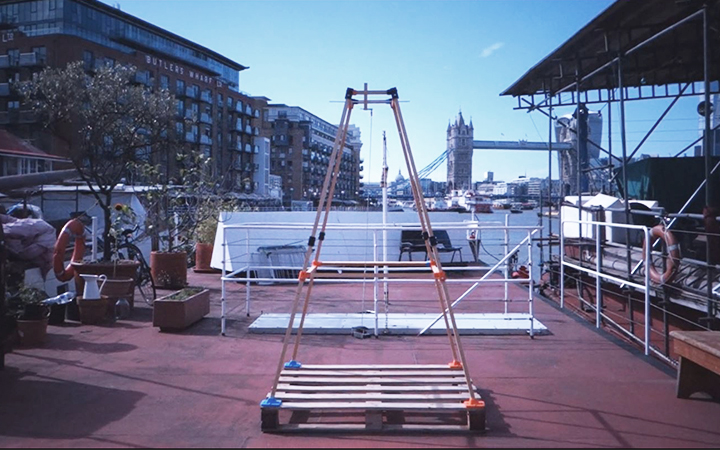
1. The Pendulum's structure
A structure built from recycled materials, mainly wood, found on a boat community next to Tower Bridge. With the idea of being easily assembled and disassembled, I designed and fabricated 3d printed joints. The structure is then used as a support for a Pendulum and other devices.
2. Field Recording – The Thames data
At first, the Pendulum's structure is left at its natural state. The Pendulum oscillates freely. The use of a Huzzah records and collects the different accelerations of the device, showing how the Pendulum reacted during the periods of high, medium, and low tide. It then sends the data to a web page and consequently saves it as a JSON file.
Logically we would think that the Pendulum would move quicker during high tide than low tide. It is partially true. During low tide, depending on how busy the river is, there could be other factors that have an impact on the Pendulum's oscillation: a Thames Clipper, the change of the current, the wind, and other inhabitants of the Thames. They all had a significant influence on the data collected, showing the complexity of this ecosystem differently.
During the recordings, I was also interested in exploring and searching for other parameters such as sound and raw materials from the Thames.
Throughout the shifts, I left a mic on the structure to record the sounds that occurred and transformed them into a composition on pure data for the final installation.
As a raw material, I discovered about iron nanoparticles, a metal pollutant that today is part of the Thames and many other water environments -probably all.
- Studies of the Thames river's sediments have reported concentrations of heavy metal to exceed chronic levels (Spencer et Al., 2006). Furthermore, recent studies have been looking into the ecotoxicity of iron nanoparticles and have been found to harm cells of microorganisms. -
I was able to collect this material during low tide on the Thames beaches, using a magnet.
In this simultaneity, the river's beauty can be measured through its contrasts and contradictions. There is a discrepancy in the discovery of things. In the Thames, we are as likely to uncover an artifact from prehistoric times as we encounter a dead body floating on the surface. It is polluted yet full of wildlife. It is irregular yet systematic, as its tide continually exposes the two sides of things. Contradiction lies at the heart of the Thames we know today: once an open sewer, it became a flourishing natural environment.
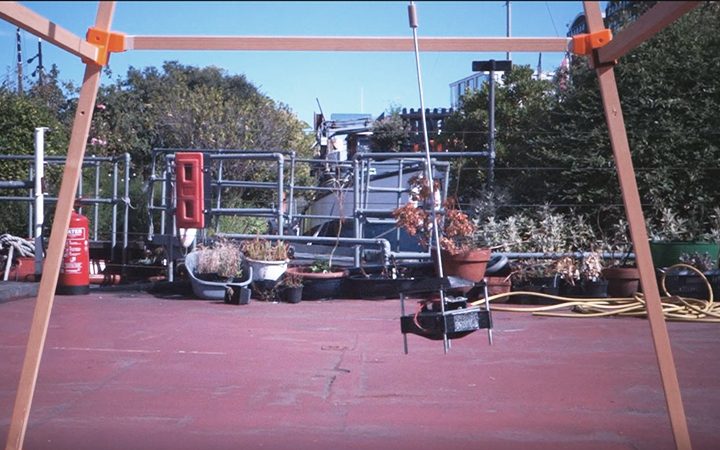
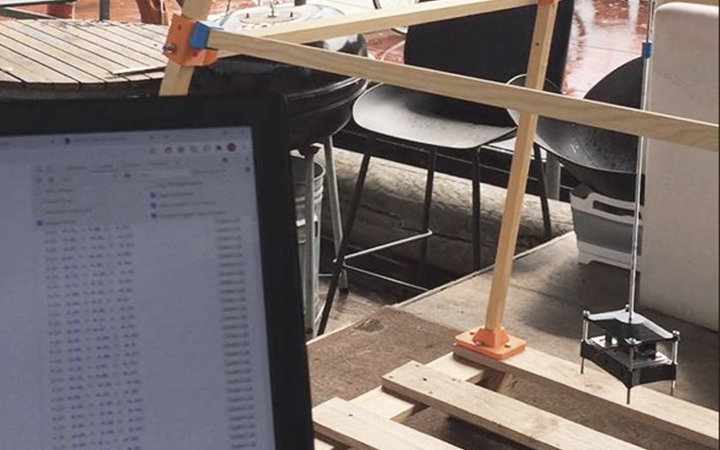
The Tide's Pendulum in its natural state: oscillating and sending its values to web page and then saved as JSON files
3. The Installation
The interactive installation is composed of the Pendulum's structure, an extension to support a plate of sand magnetite, a monitor, a Raspberry Pi, and speakers. The aim was to create a sort of cabin of curiosities: the more you approach the installation, the more elements you discover.
The Thames data is sent through serial messaging and activates three different stepper motors. Their direction, speed, and acceleration will depend on the value they receive during the tidal data. The values reflect the behavior of the Pendulum at its natural state. As a result, when the motors receive a value that it's high -high speed- they will perform differently from their medium and low speed.
The motors trigger the rotation of three magnetic mechanisms, which consequently interact with two physical elements; a magnetic pendulum and a plate of sand magnetite.
The movement of these two elements combined with OSC messaging, generate visuals, and interact with sounds. The visuals illustrate the paths of the Pendulum. The paths will change their style, from a dashed and noisy line to a continuous one. Each class of line defines what period the river is experiencing: low, medium, or high tide (see image n°5 & n°6 below). Regarding the sound, during the installation, there will always be subtle background noise, but as soon as the elements increase their movements, new sounds are triggered.
Every single movement, generative visual, sounds illustrate abstractly the patterns that are created during tidal shifts. From high to low tide, the devices oscillate, change, transform, showing the complexity of such a rich and diverse ecosystem.
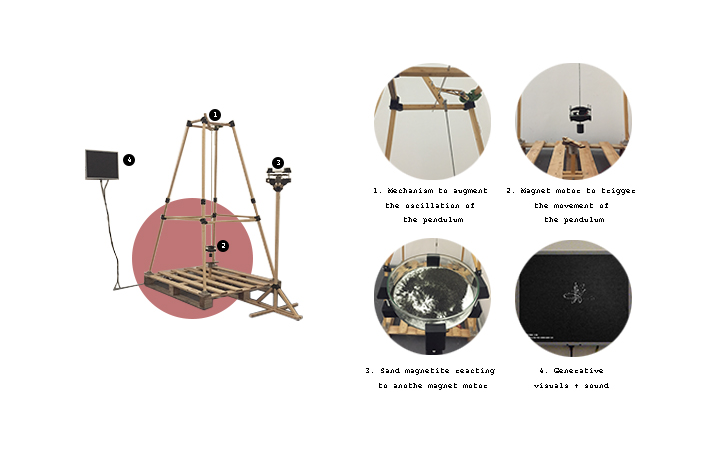
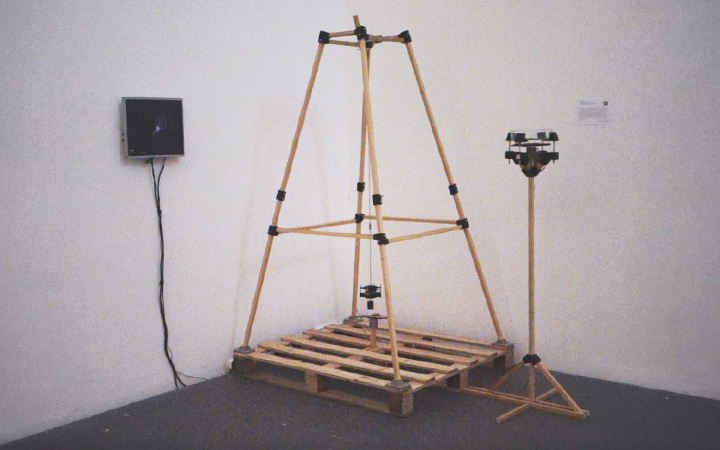
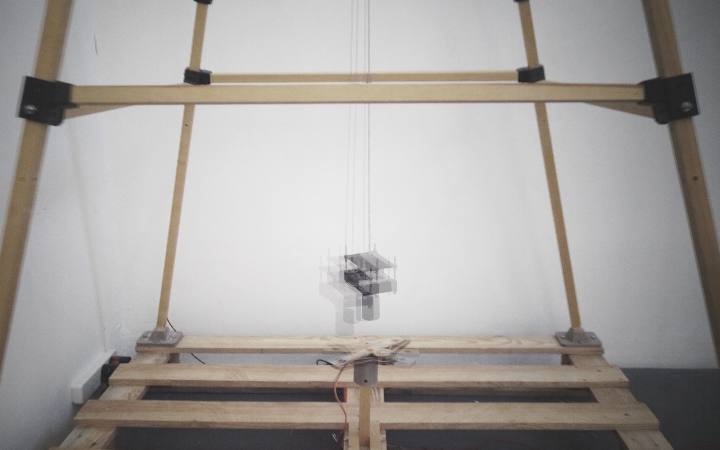
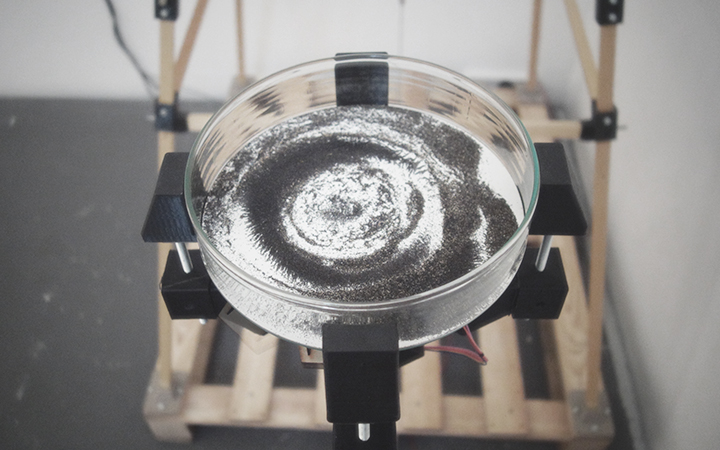
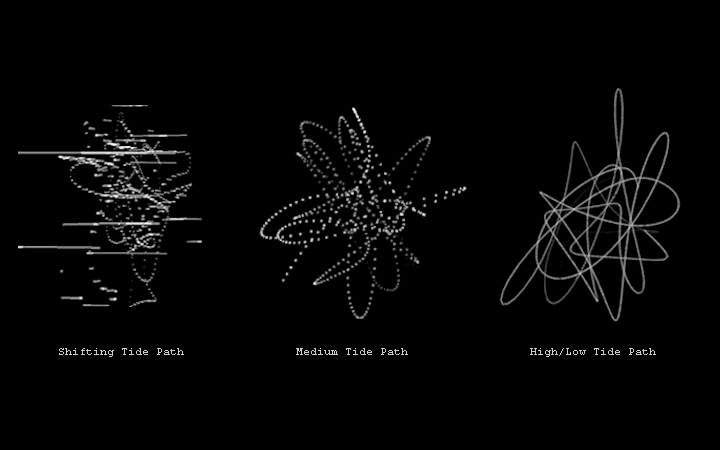
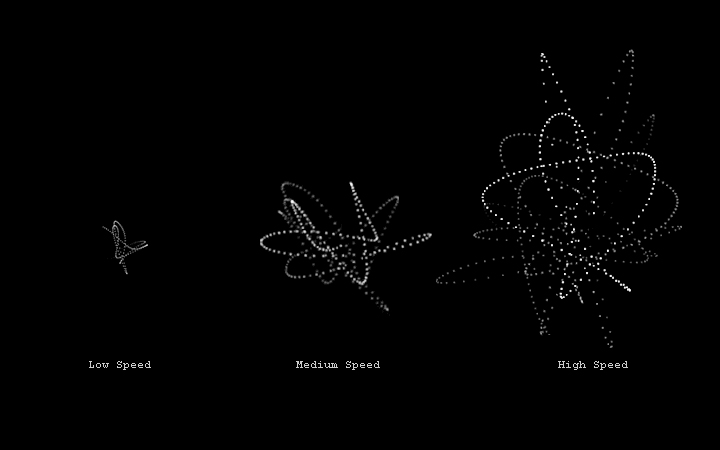
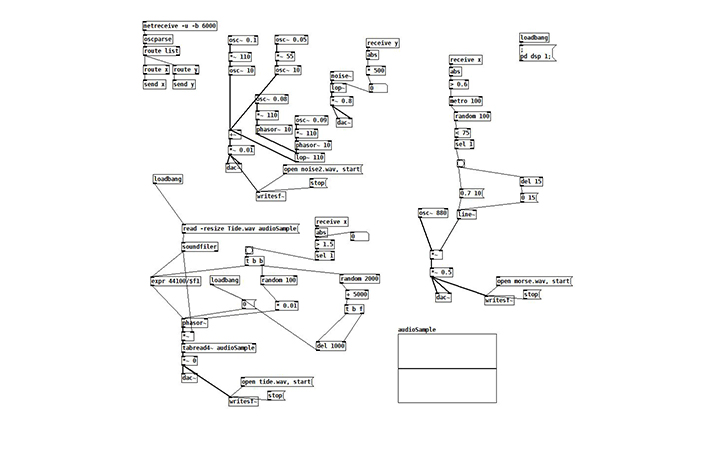
From left to right: 1|Diagram of the installation's components 2|Final Installation 3|Pendulum in action 4|Sand Magnetite transforming 5|The different path styles created during Tidal shifts 6|The paths size depends on the value (acceleration of the pendulum at its natural state) the installation receives: the higher the speed the bigger the paths 7|PureData patch
Future development
Perhaps, as a first step, it could be interesting to optimize how I collected the Thames Tide data. To do so, I would redesign and build a floating autonomous structure, easy to transport, assemble, and disassemble. It would need to have an autonomous network and a web app to receive and send remotely real-time data. Be waterproof, and add a camera to the pendulum to gather more data. Consequently, it could be interesting to apply this device in different places, maybe somewhere else on the Thames, a less busy area, or a completely different water environment.
After optimizing and applying the device in different places, I would rethink and redesign the physical installation. It will receive and interact with real-time data. Depending on where the devices will collect data, the components, structure, and aesthetics of the installation, will probably change.
Self-evaluation
There were aspects I would have liked to improve. On the one hand, one of the goals I set out was to have two structures that communicated and exchanged in real-time: one collecting and floating on water, and the other remotely interacting with the real-time data. It did not happen for the simple fact that it went out of my know-how (sending real-time data remotely, even if I was close to making the system work) and lack of logistics for the floating structure. So I decided to elaborate as best as possible this project, with the tools I already had.
On the other hand, to build an autonomous device. For example, as the device collected data, most of the time, I had to intervene manually and stay vigilant during the collection of data, making sure the network was working (poor connection), especially when it rained.
Overall I am satisfied with this project. I managed to elaborate a process that I can carry on working, the installation functioned on a Raspberry Pi, I have learned about my limits, and when to say stop, but especially had a lot of fun!
References
A special thanks to all the inhabitants of the Thames river.
Theory
1| ‘For Space’ by Doreen Massey 2005 Sage publication Ltd
An incredible thesis on how we should renew our relationship to space and consequently how we should approach it.
2| ‘How the River Thames was brought back from the dead’ by Sophie Hardach BBC Earth Wed 12 Nov 2015
An interesting collection of facts about the Thames.
3| ‘The Thinking Hand: Existential and Embodied Wisdom in Architecture’ by Juhani Pallasmaa 2009 John Wiley & Sons
Pallasmaa critiques the predominance of visual perception and how we should explore and be aware of our other senses.
4| ‘Responding Bodies and Partial Affinities in Human Animal Worlds’ by Vincianne Despret 2013 Research Article
Research on how scientists used their bodies to understand and engage with non-humans.
Code
1 |Real Time Data Websockets: Acrobotic https://www.youtube.com/watch?v=tGR5zqN9M2E&ab_channel=ACROBOTIC
2| Drawing Lines: https://openframeworks.cc/ofBook/chapters/lines.html
3| OSC messaging: Creative Coding Lecture