


Through the Window
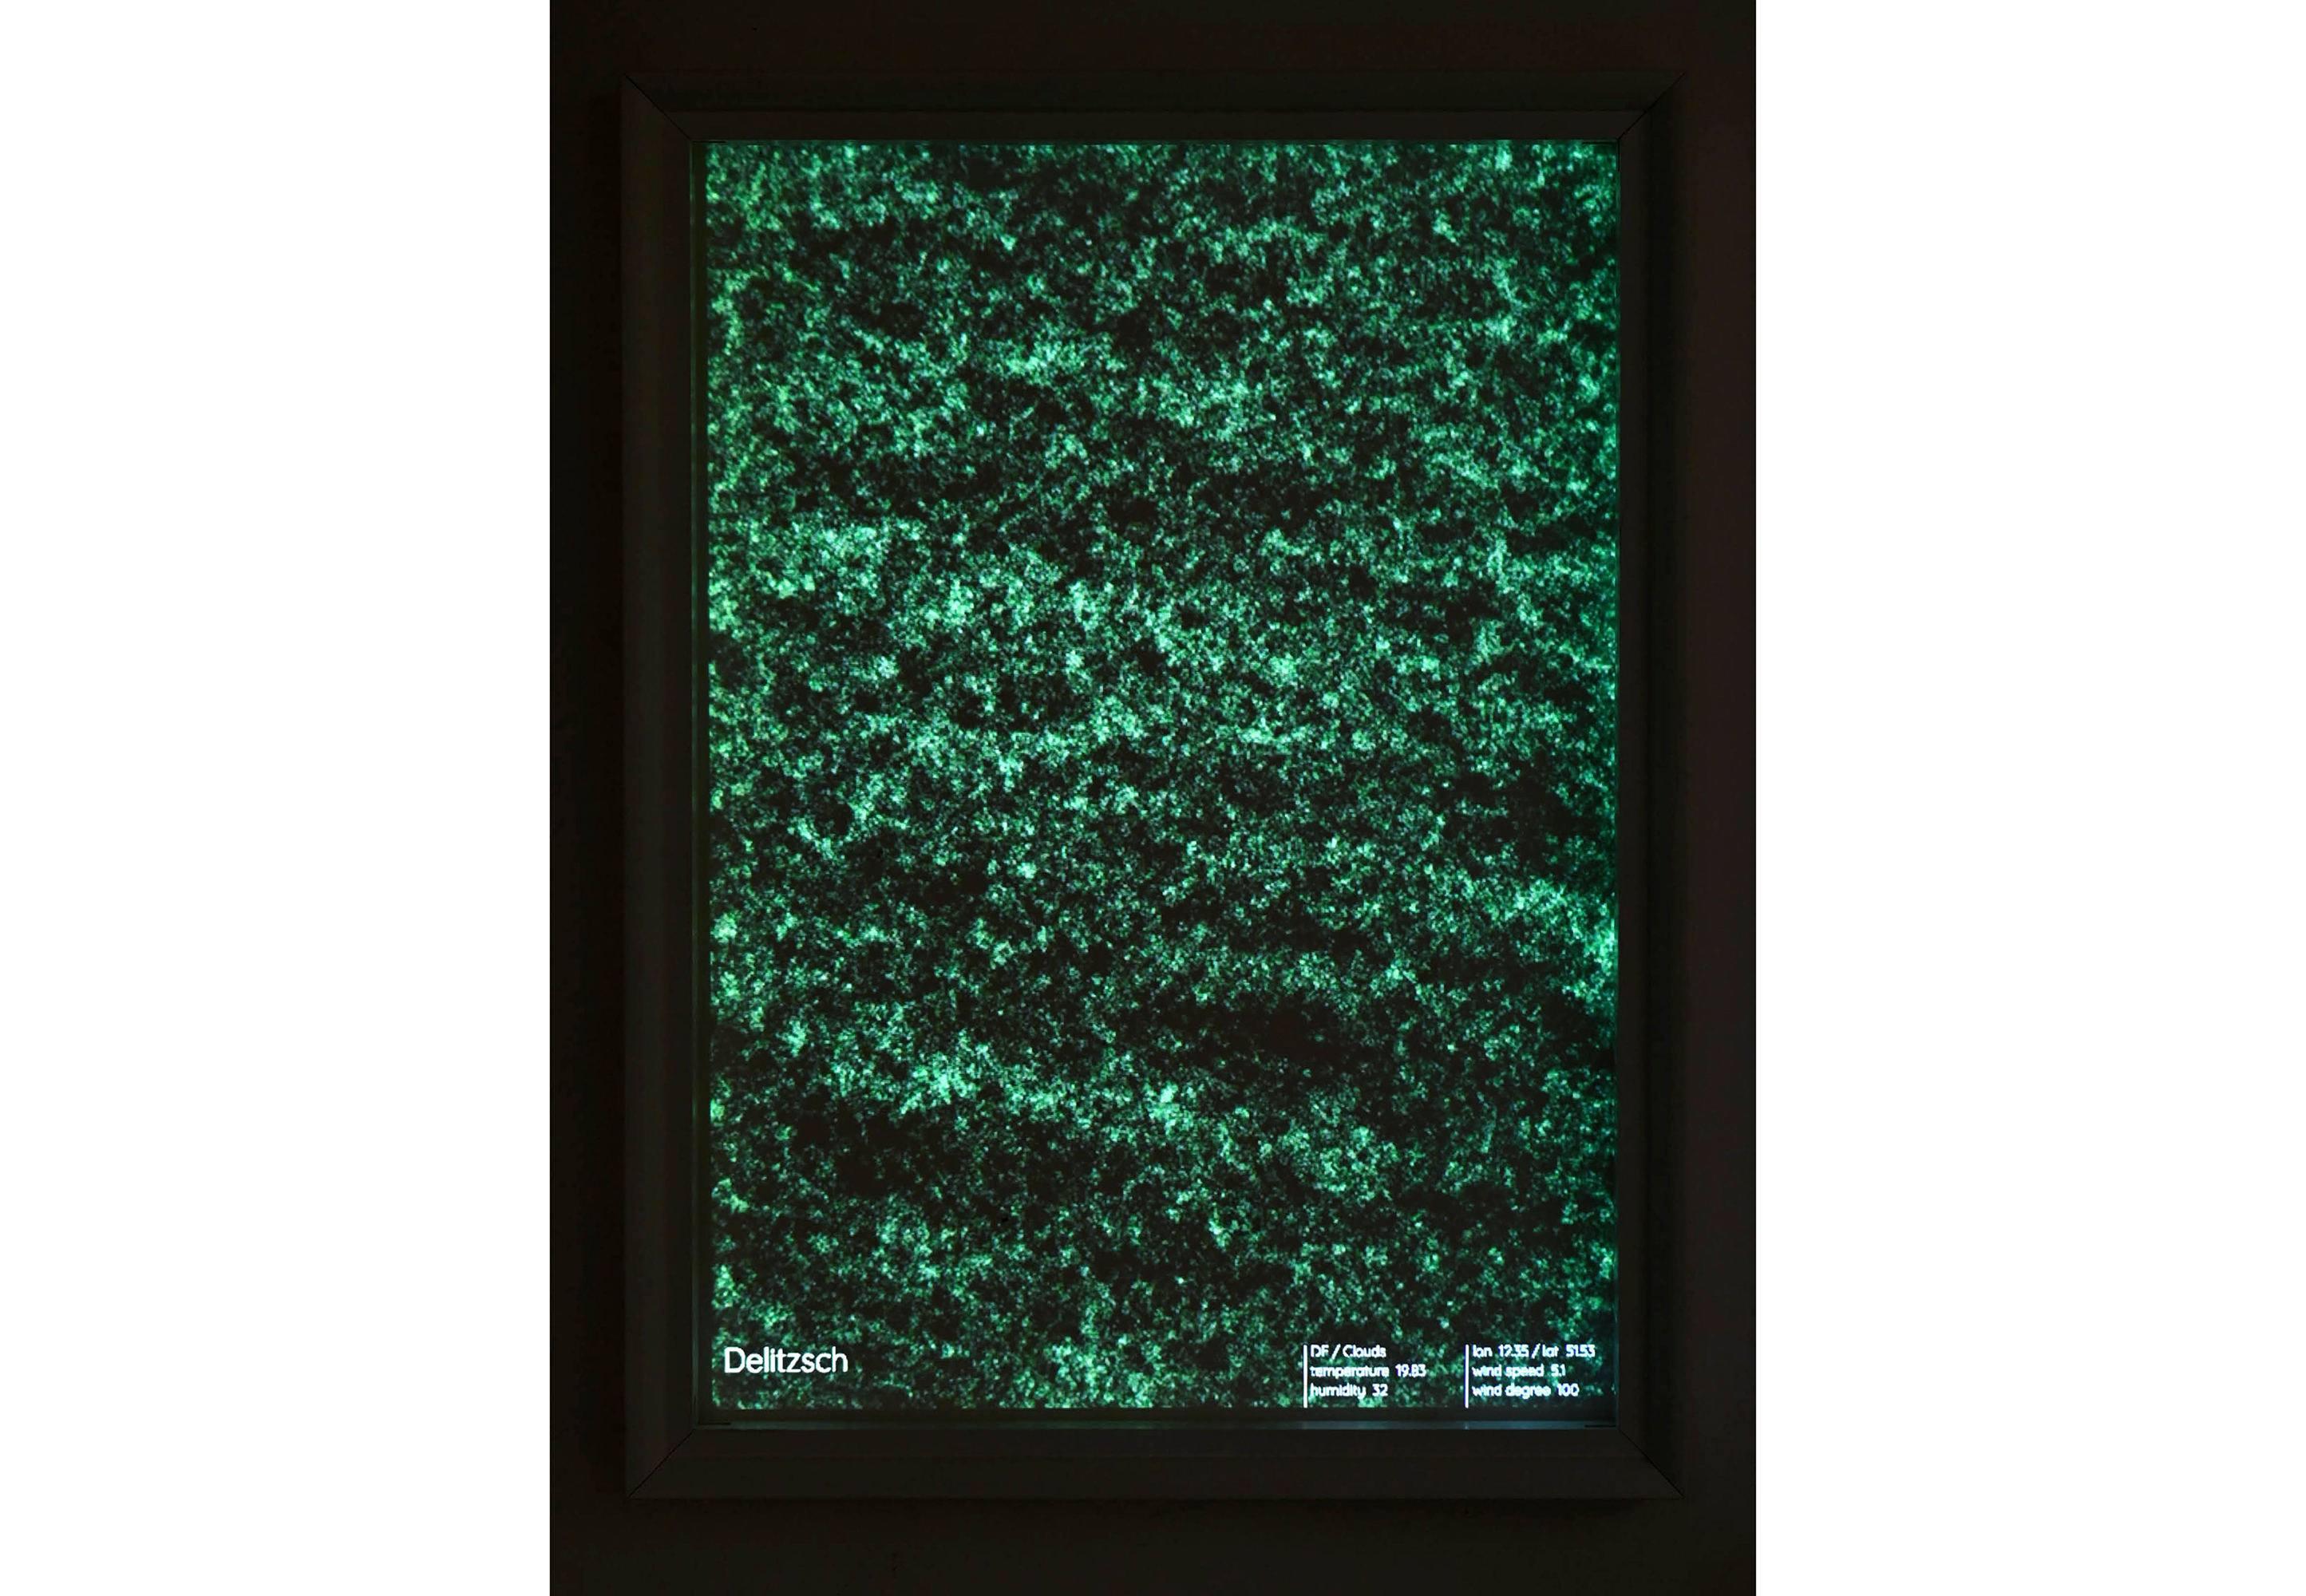
An installation of real-time weather data visualization. This project will take viewers on an imaginary trip with the changing greenery images comprised of weather data of cities around the world, while connecting humans and nature, the place viewer standing and outside the window.
produced by: Eri Ichikawa
Introduction
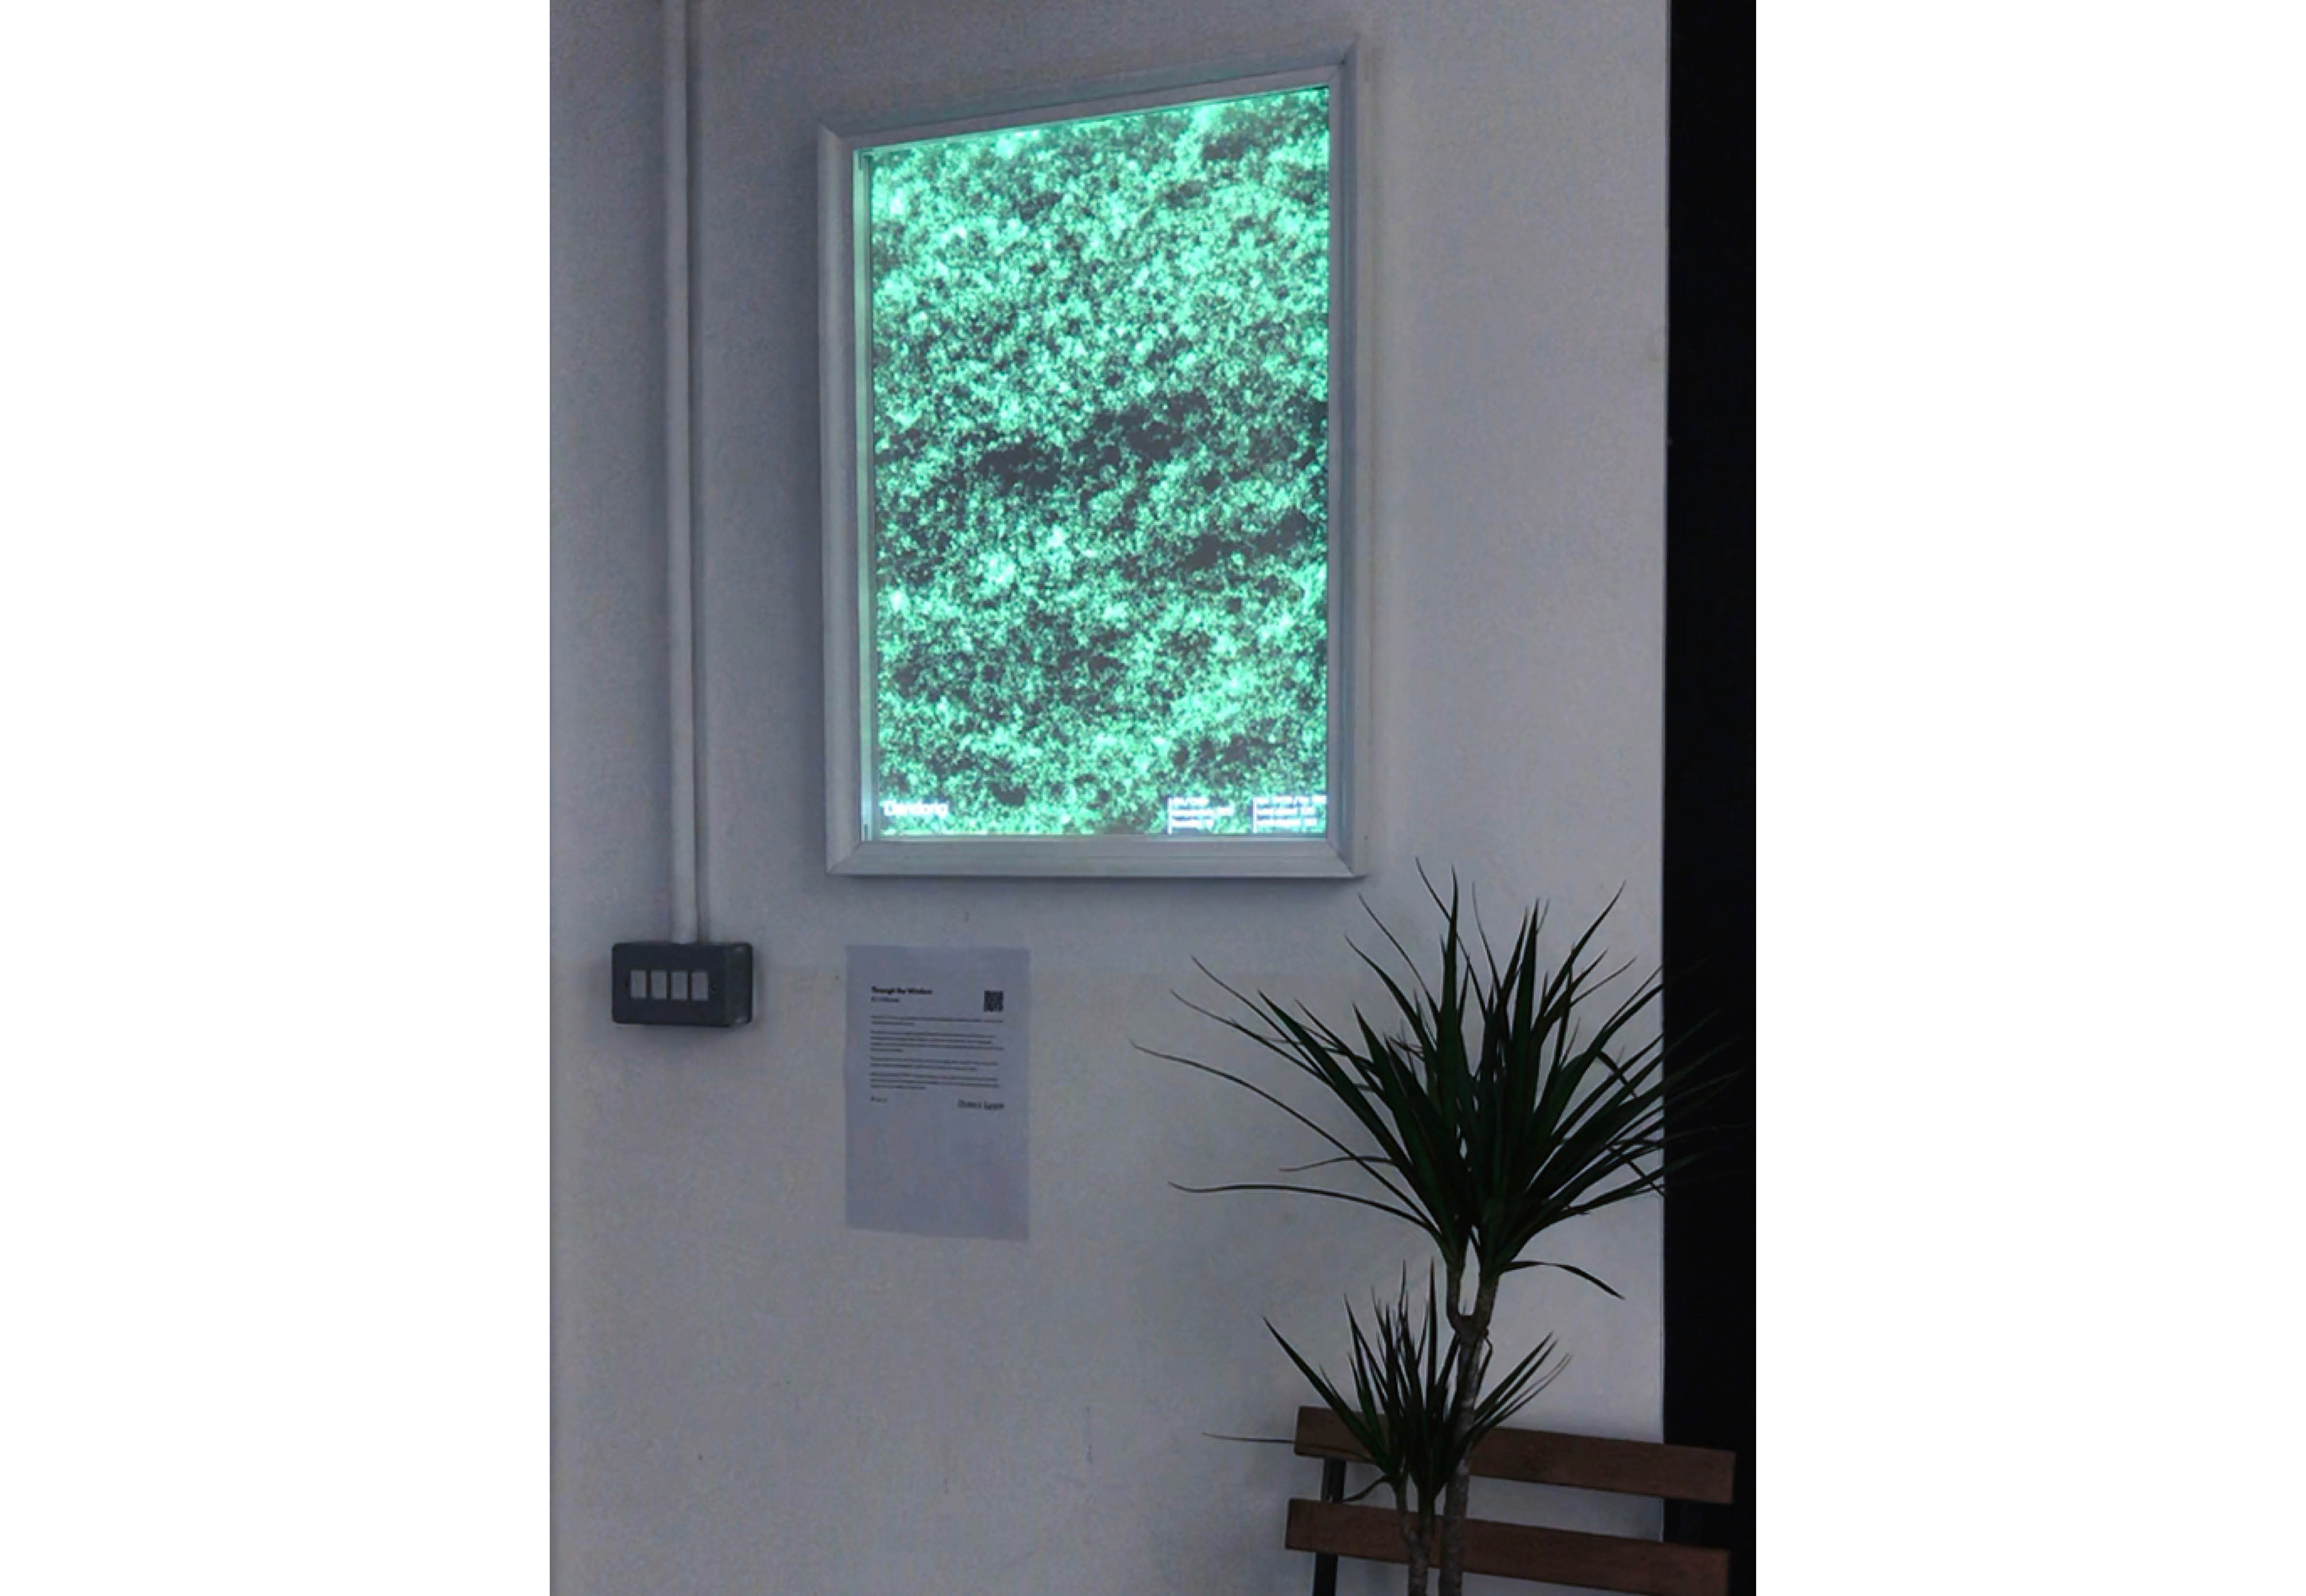
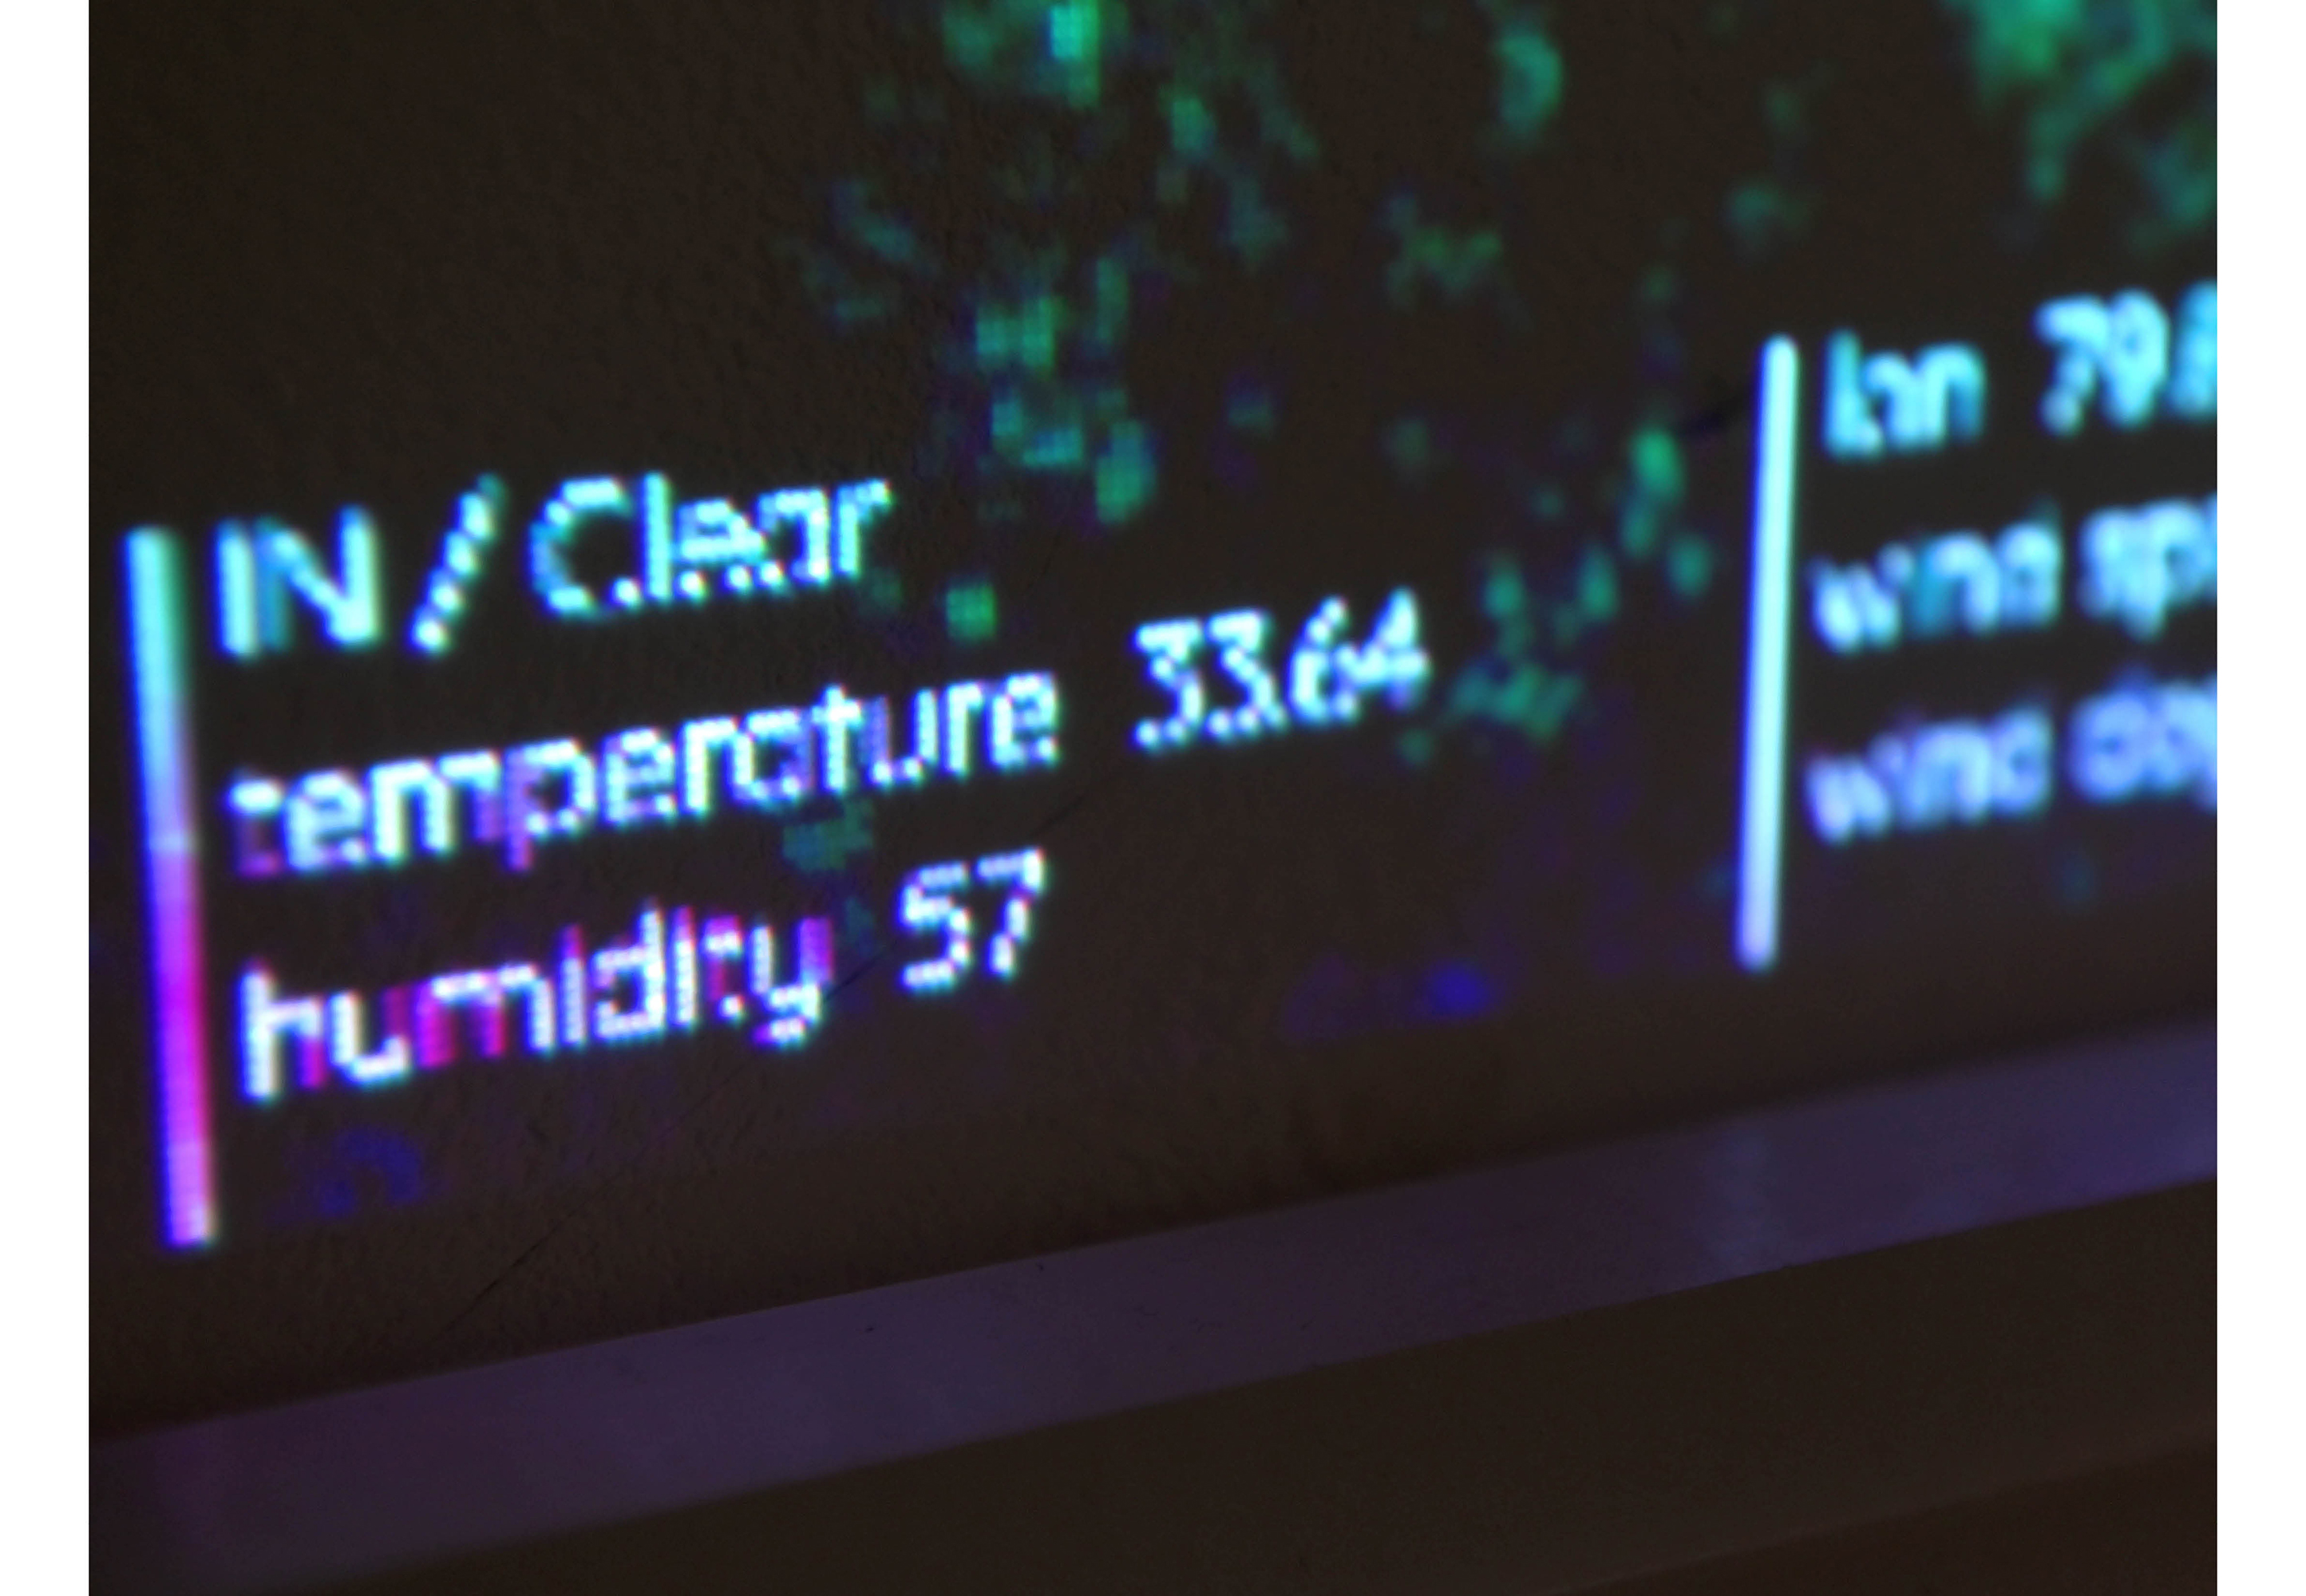
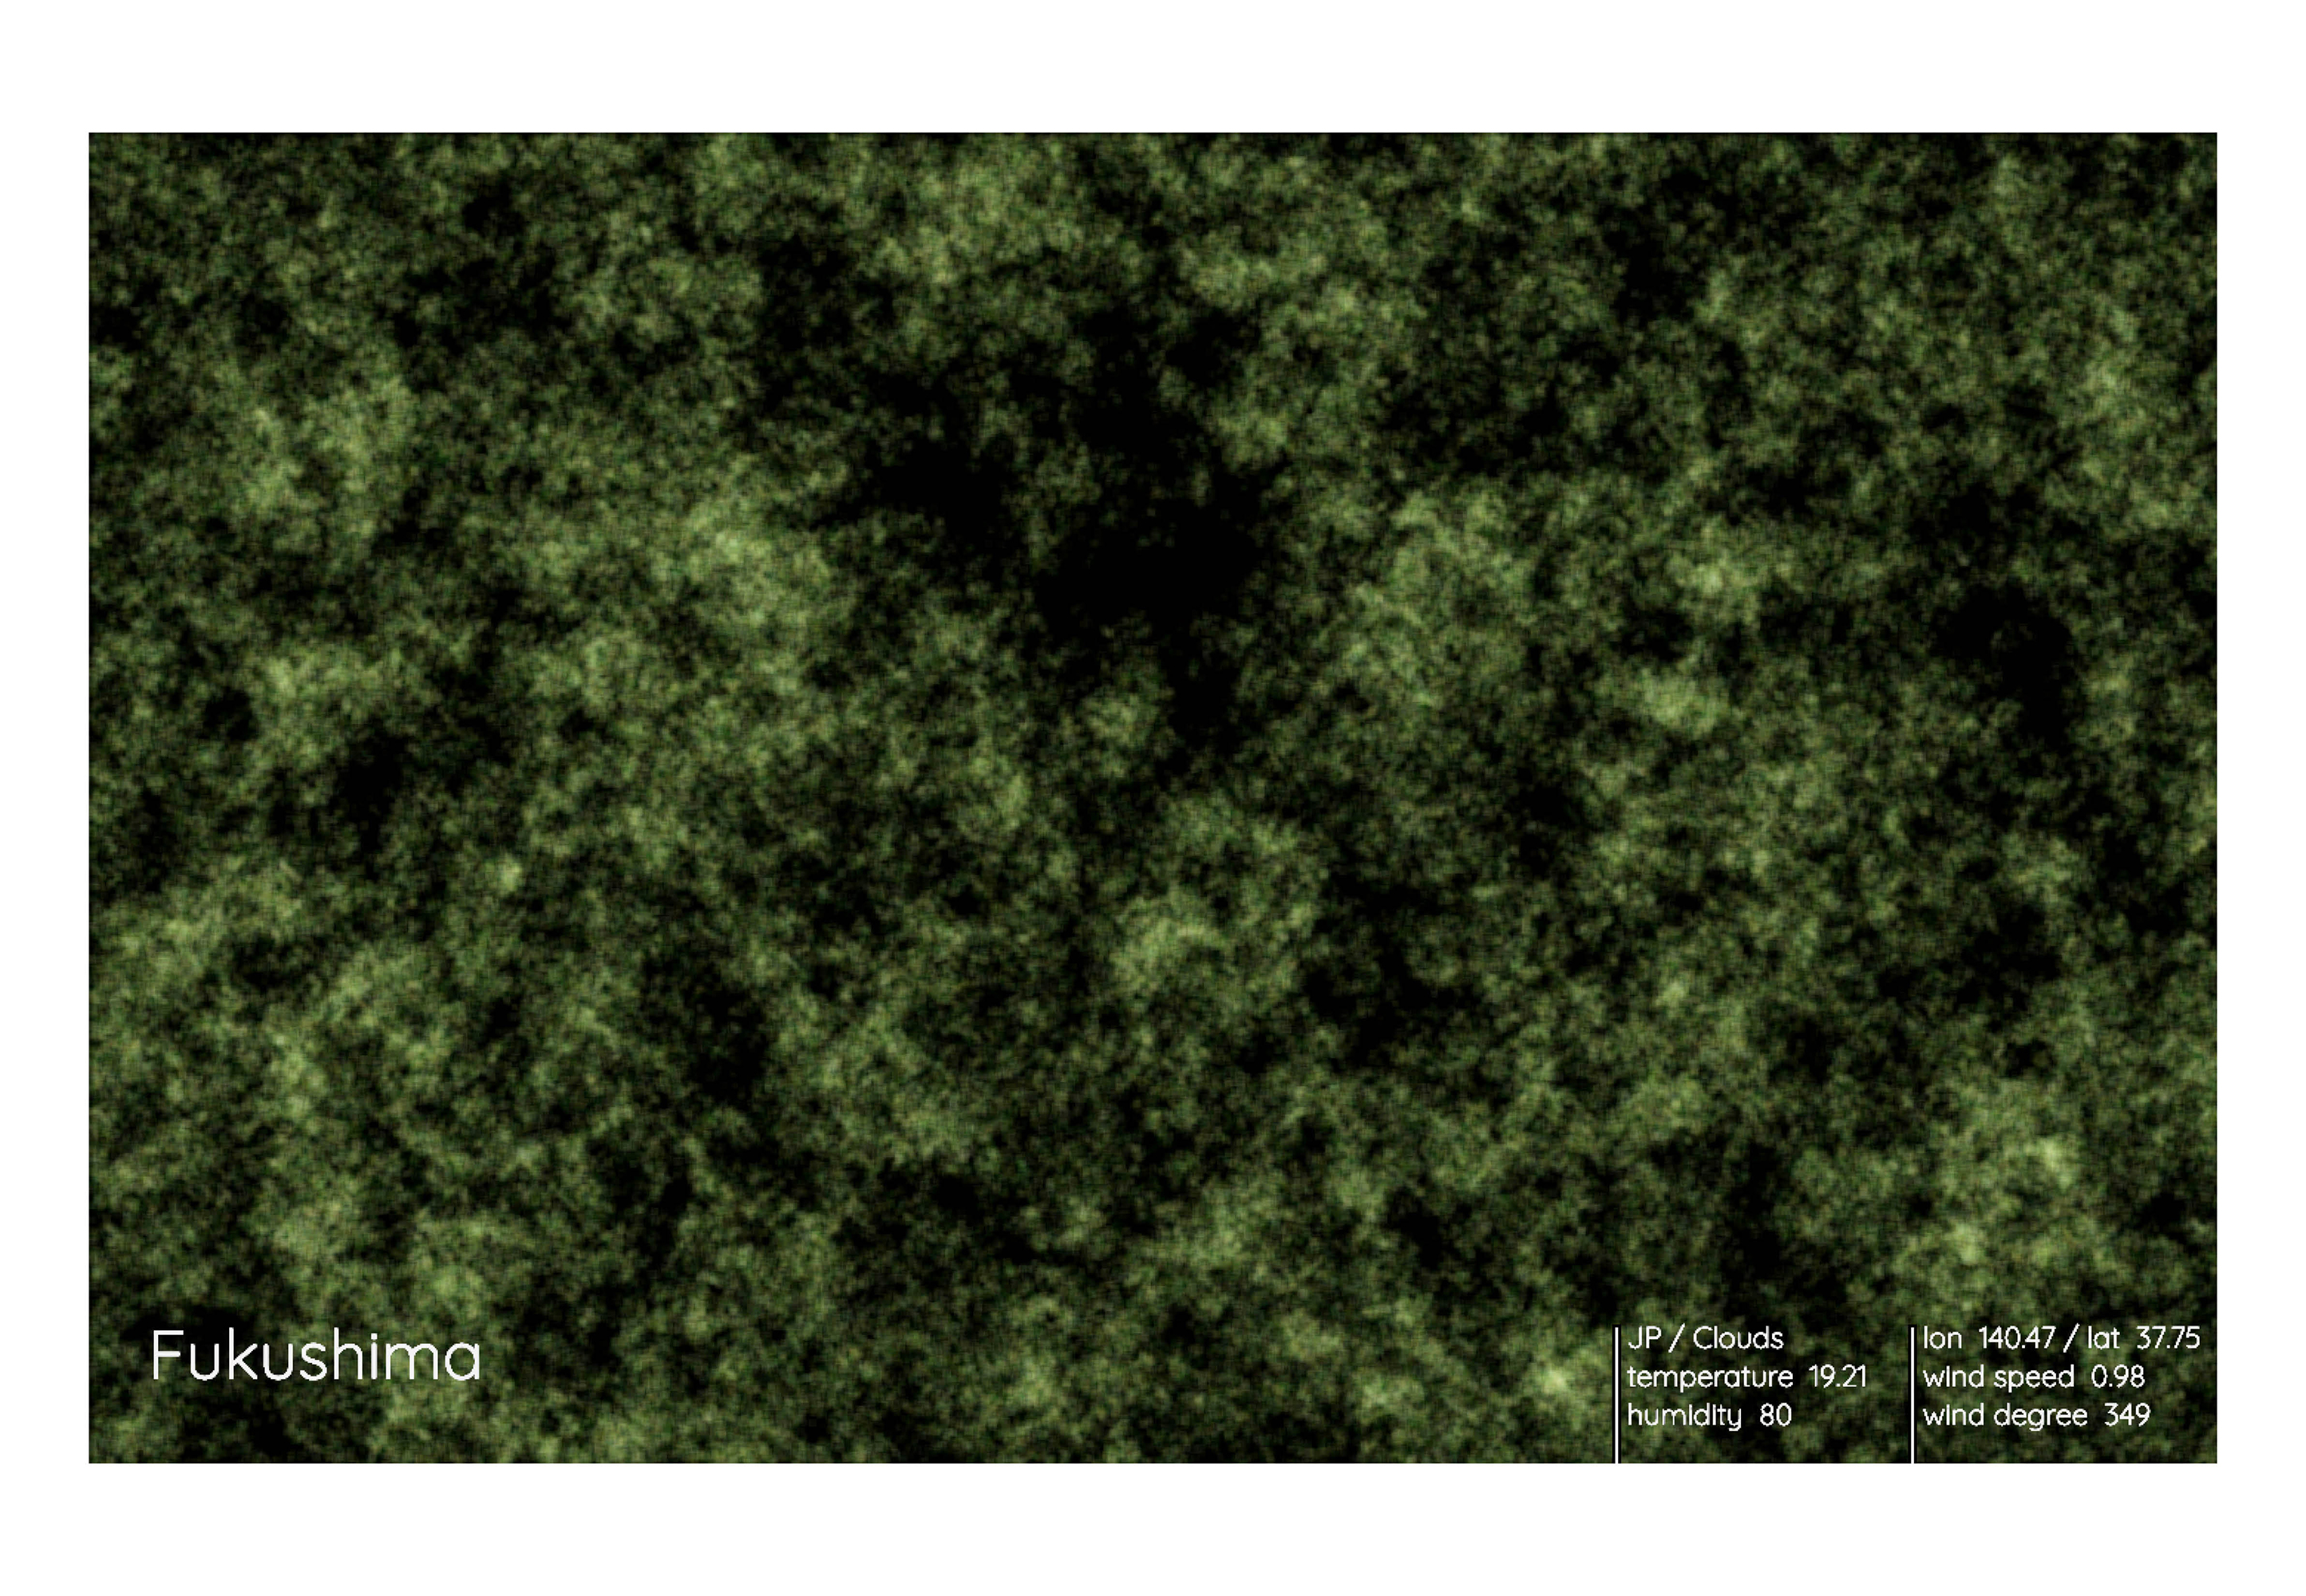
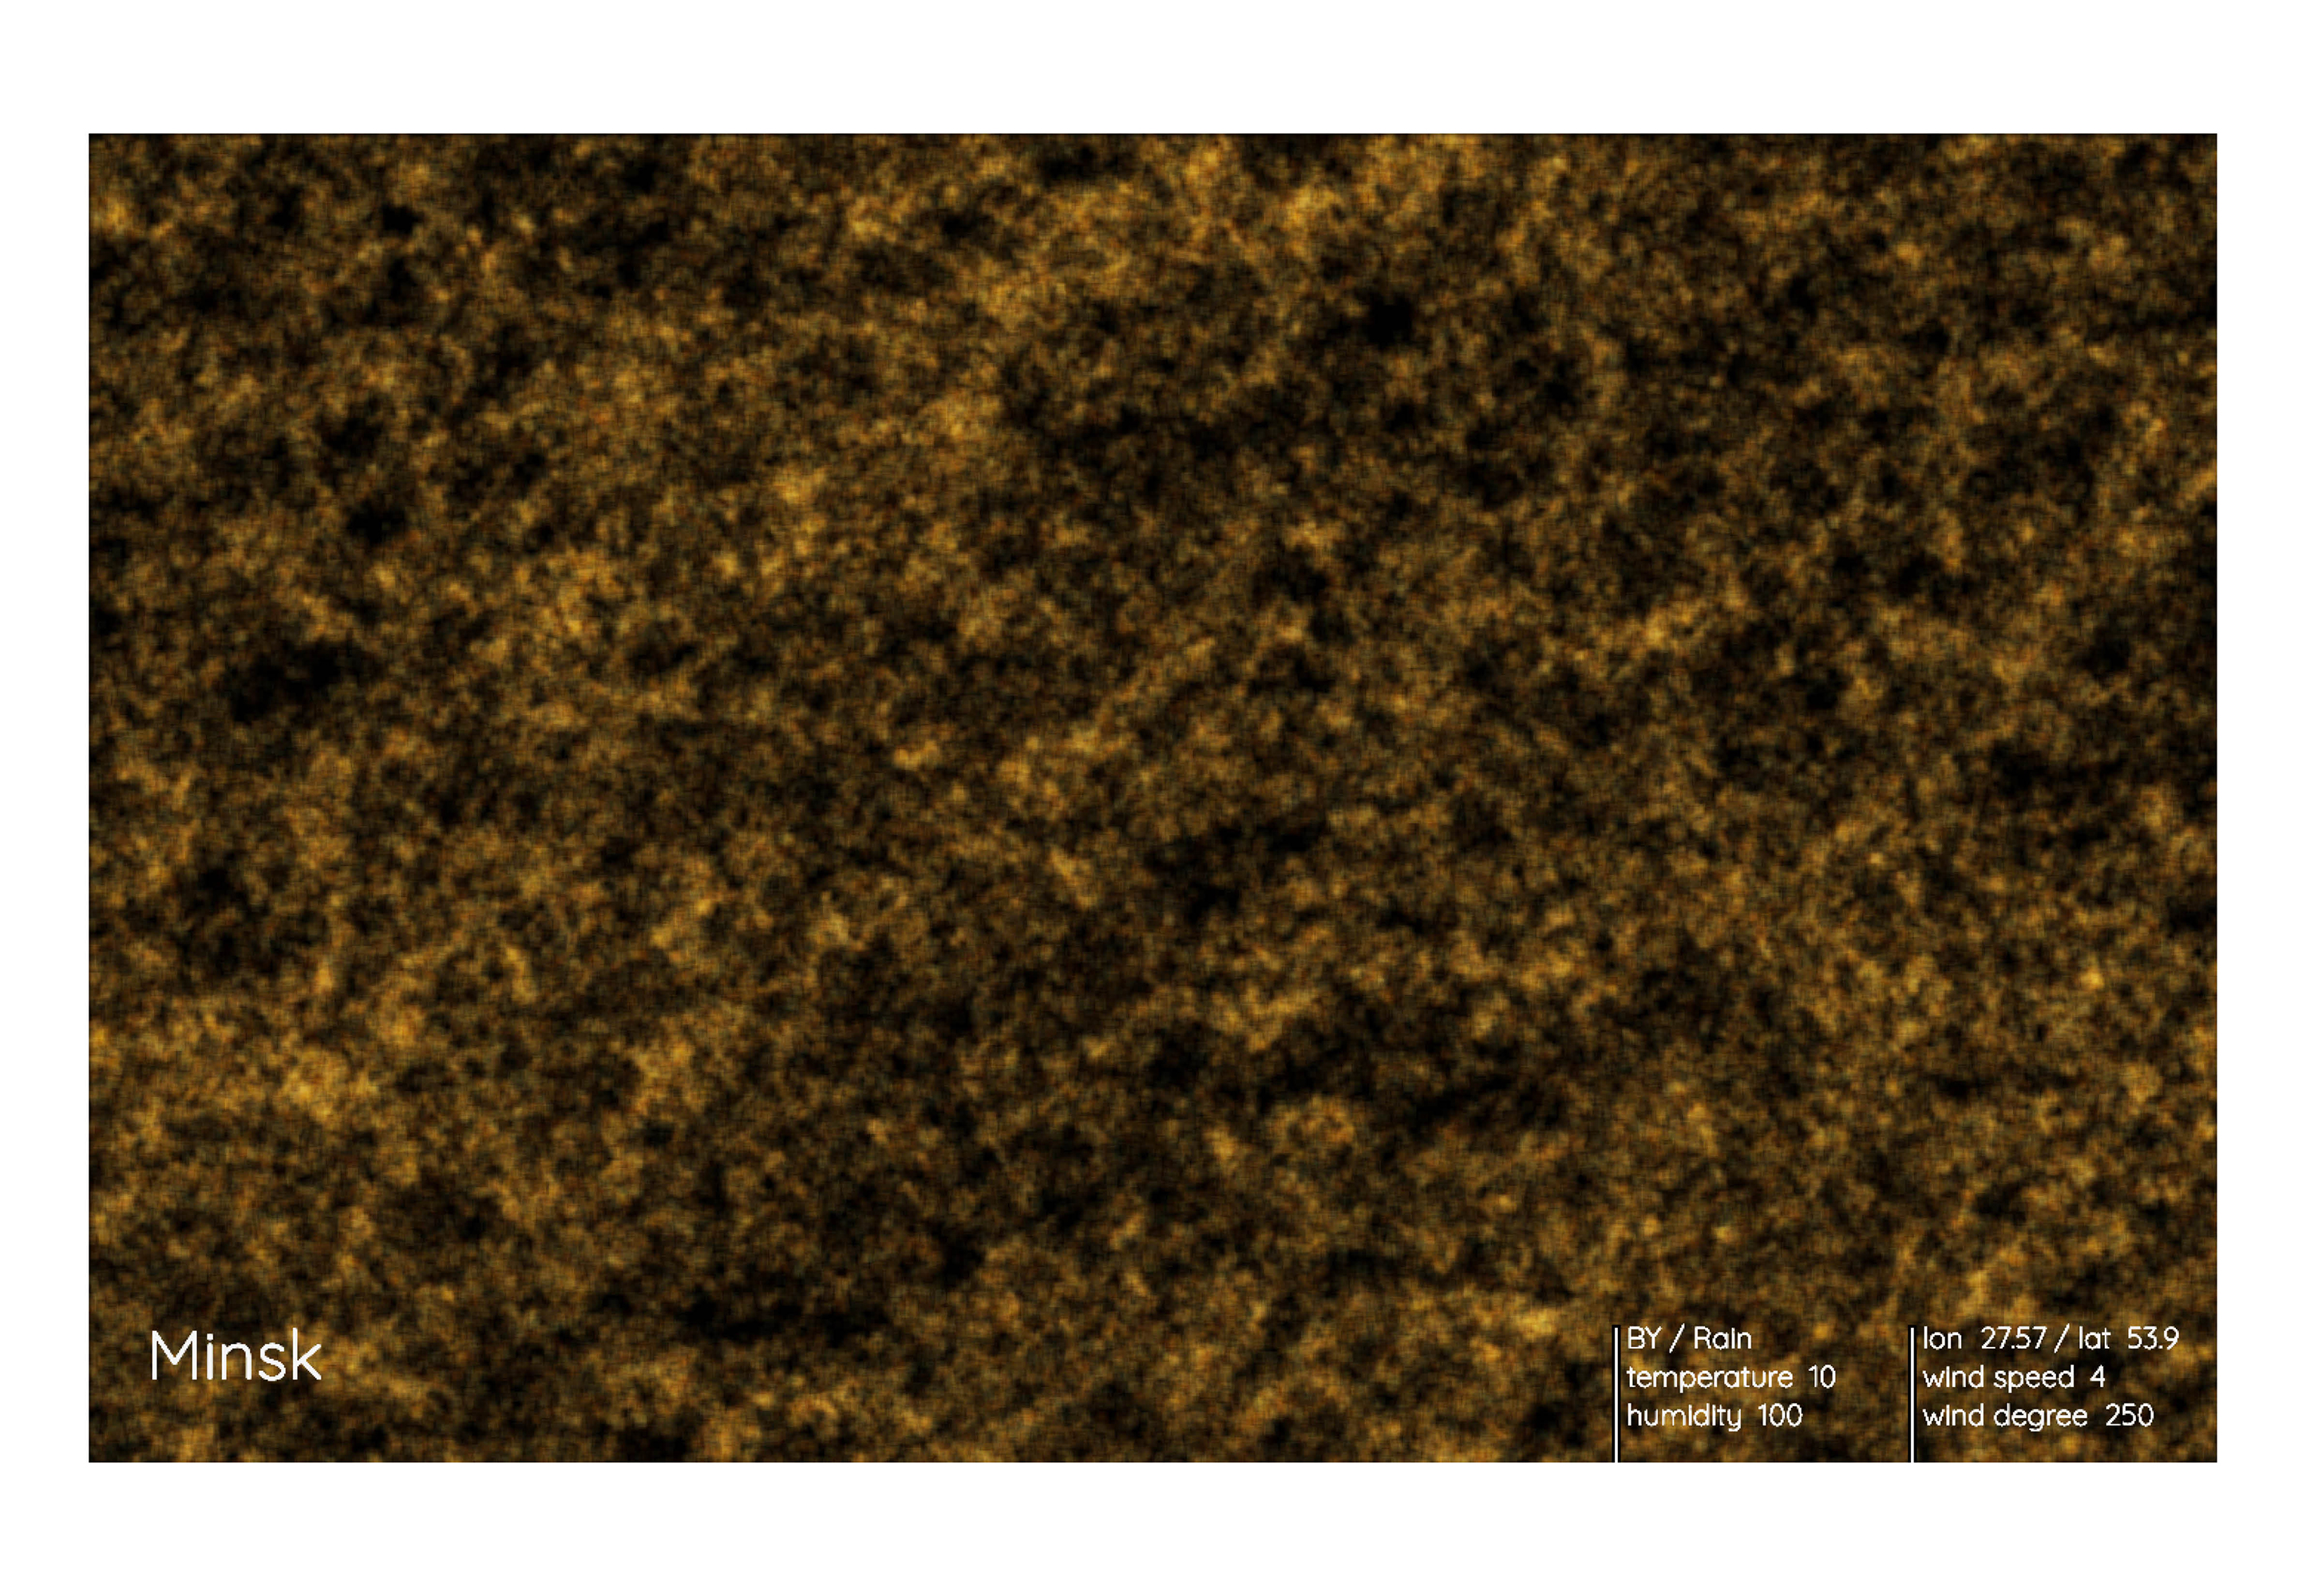
Through the Window visualizes real-time weather data of more than 150,000 cities all over the world. The city being displayed changes every 30 seconds, and those are selected randomly. Meanwhile, the colours of the image change depending on the temperature. For example, when it is between 20 and 30 degrees, the green becomes deeper as the temperature gets hotter. When it is below 20 degrees, the colour becomes almost pale green and yellow, as seen in autumn leaves. Below 10 degrees, the colour turns into smoky blue as seen in trees on a snowy mountain. If the humidity is over 50%, the particles of green increase transparency; as a result, the contrast of the particles becomes lesser and the overall impression becomes softer. The particles’ growing direction and speed represent the wind degree and speed of the data. Viewers can feel as if they are travelling around the world as they look through the window while observing the climate of the city symbolized with coloured images.
Concept and background research
The living wall image
Living walls are walls covered with living plants. When I went out for the first time after the lockdown, what inspired me the most was the living wall at the Elephant and Castle tube station. The large wall of nature appeared to me to symbolise the freedom of travelling outside. On the other hand, I have noticed that living green walls exist throughout the world, but the plants that compose these walls vary depending on the local climate—they are unique to the place. Therefore, I thought that by reconstructing living walls virtually with the inclusion of weather data from various cities, I could produce a feeling of travelling without physically going out.
The window
Several artworks which make a connection between here and somewhere else influenced this project. One is a projection mapping of waves by Hiroyoshi Asano (2017) in which waves come from the wall and flow out to the floor. The other is Komorebi (2017) by Leslie Nooteboom, which generates shadows of sunlight through the leaves on a wall. Additionally, the Anywhere Door—one of the future gadgets used by the popular Japanese manga protagonist, Doraemon, which takes you anywhere you want to go—is always in my mind. I aimed to make an imaginary hole on a wall the same as the projects mentioned, displaying visuals that will transport the viewer to another place.
The imaginary trip
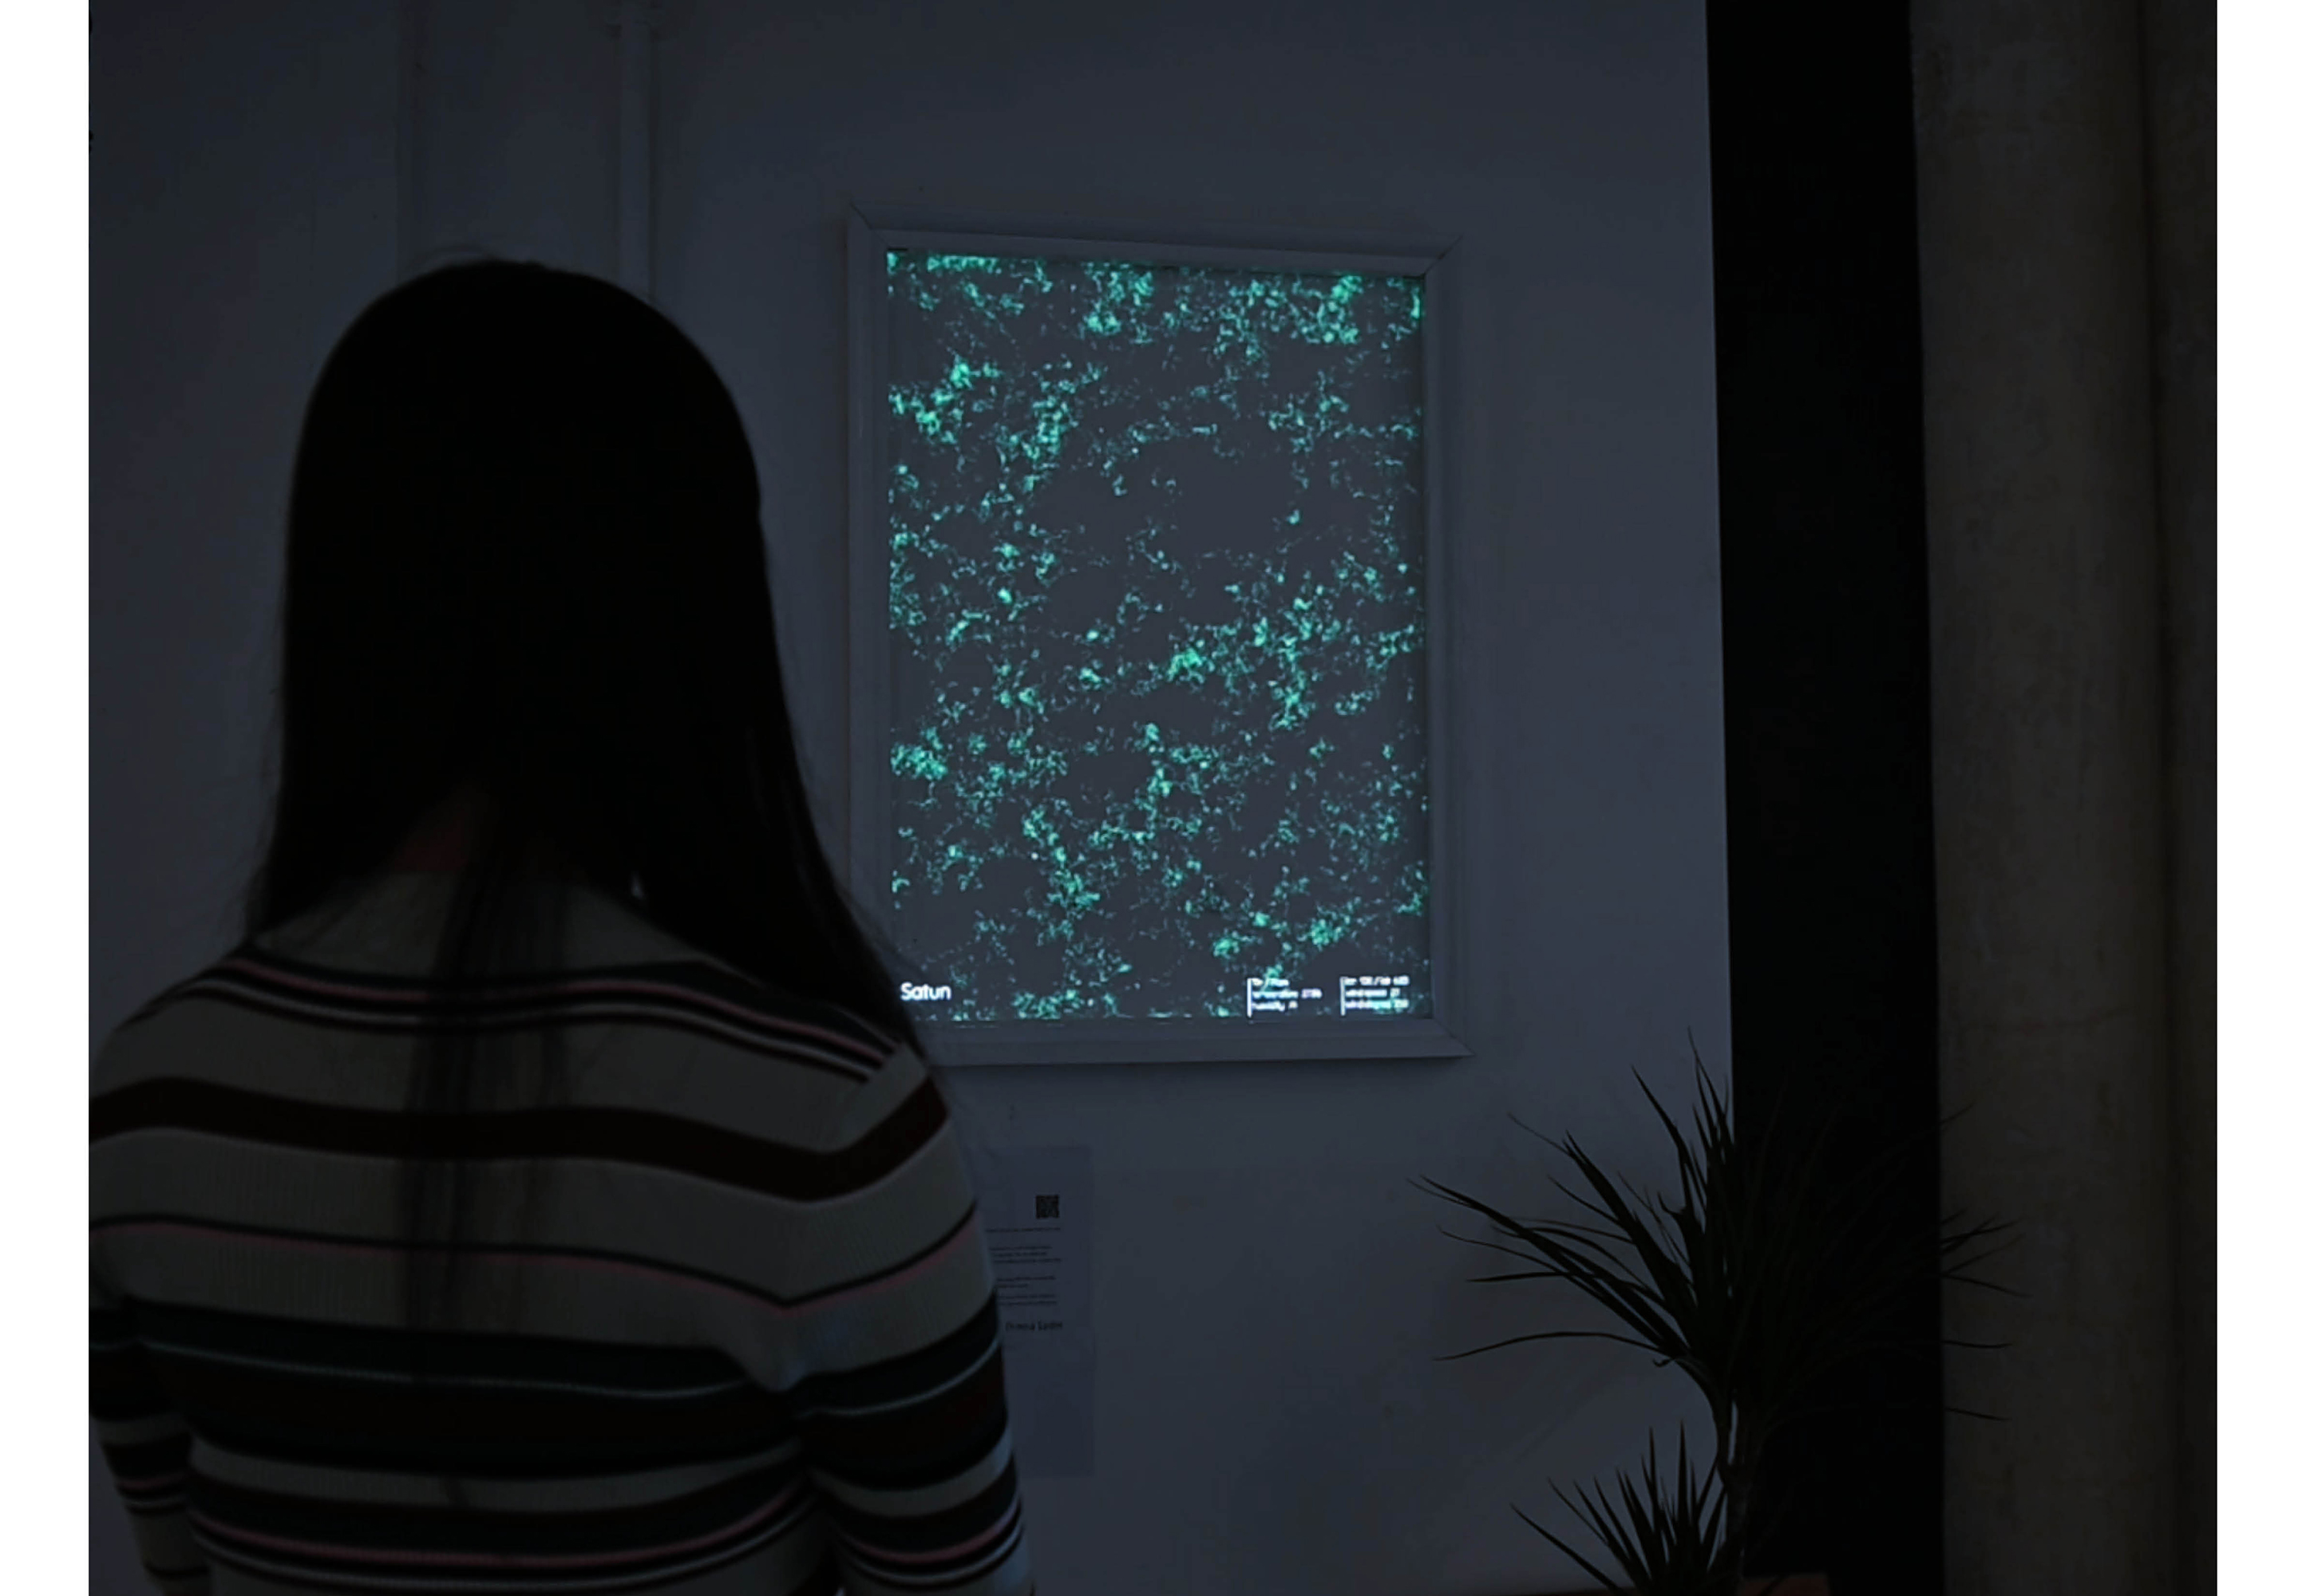
I assume many people wanted to go out of their homes, whether only one station away or abroad, while the lockdown was in place. I kept wondering what factors drive people to travel. From my perspective, travelling gives connections to others, while also letting us know what is happening outside our home or by thinking about another person’s life. Furthermore, being surrounded by nature might make one realise that an individual is nothing more or less than a component of an ecosystem and is being guided by the environment. With these thoughts in my mind, I placed my hope on this project. I hope it can provide an opportunity for viewers to have objective perspectives and hone their imaginations and to increase their empathy for others, while letting their thoughts go to nature or neighbours living in unknown cities or reminding them of what is happening there when they encounter places often heard.
Reproductivity
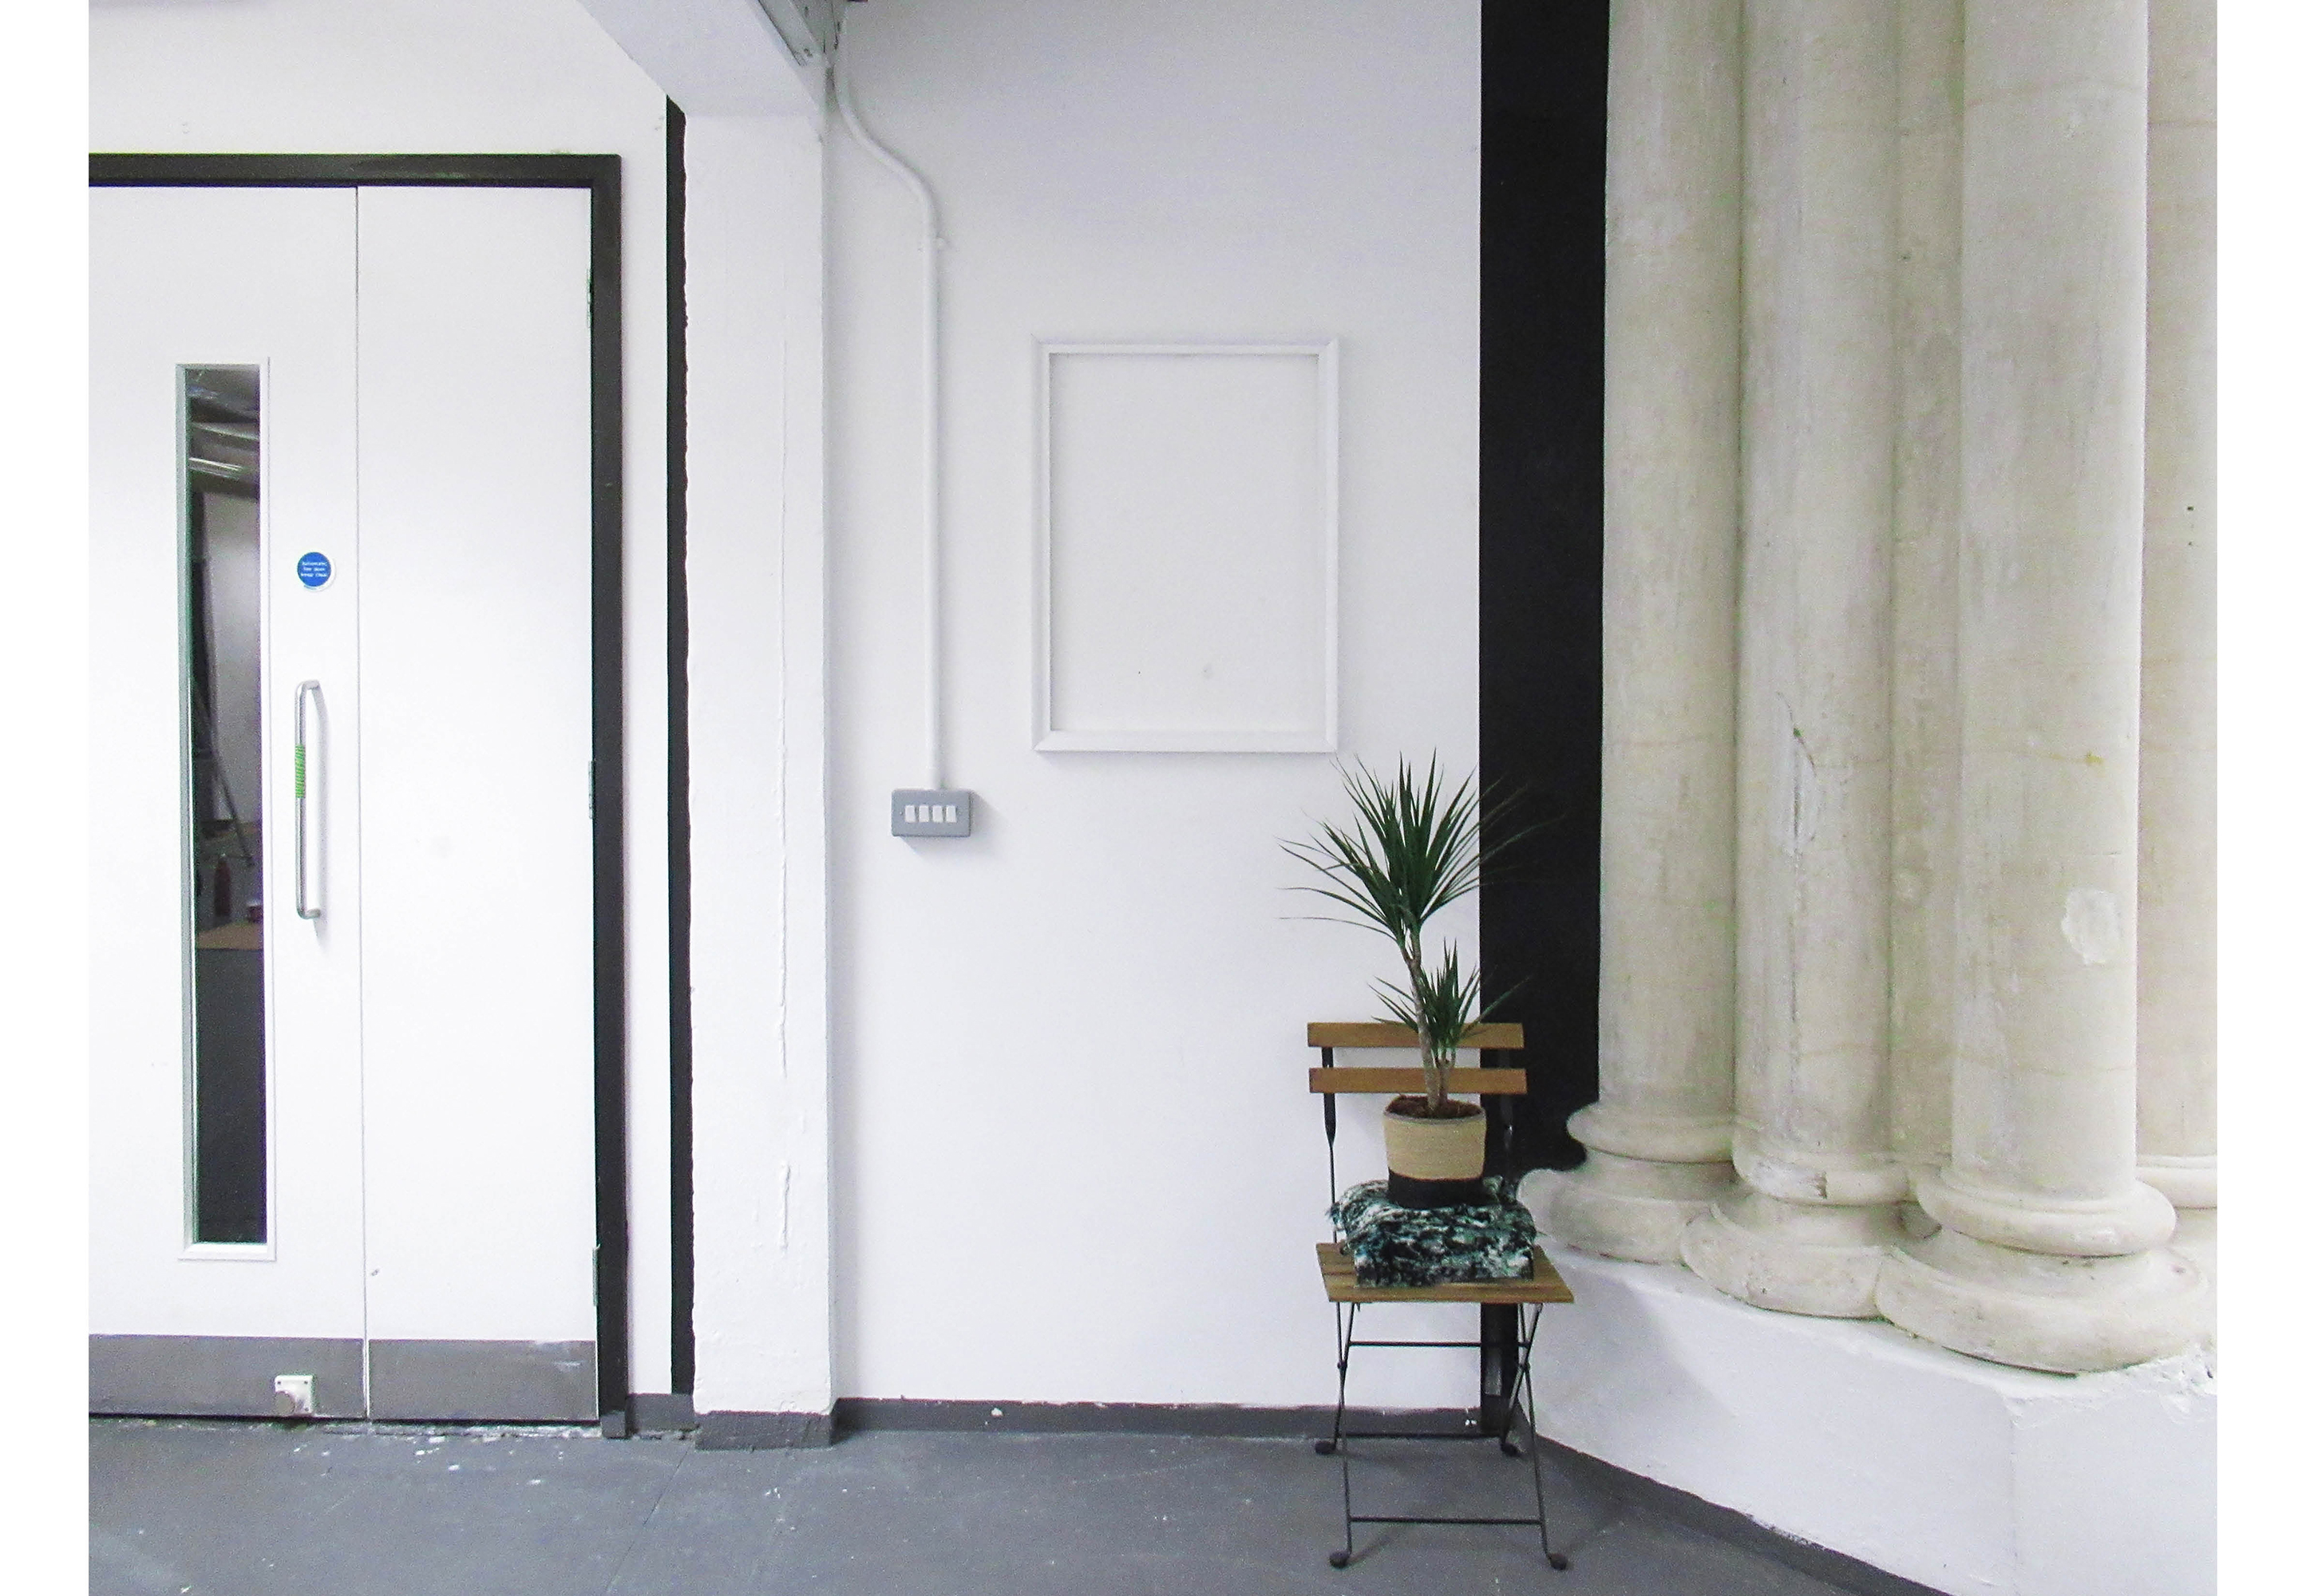
In parallel, I wanted my final project to be something practical and closely related to everyday life. I thought about the use of technology from Color Push (2020) and Hand Up/Down, with their usability, familiarity and amusement. To go further, Bruno Munari (1971) has already articulated what I have been vaguely thinking about, saying, the artist’s dream is to get to the museum, whereas the designer’s dream is to reach the local market. “An artist [is] useful to society because he helps society to recover its balance, and not to lurch between a false world to live one’s material life in and an ideal world to take moral refuge in. When the objects we use every day and the surroundings we live in have become in themselves a work of art, then we shall be able to say that we have achieved a balanced life.” One of his works called Concave-Convex is a flat square netting metal; however, once you bend the wire and model a shape, it becomes an object and its shadow flutters in the wind to produce contemporary art. I have been deeply impressed by his intention and works as an artist/designer. This is a form of art I would like to pursue in my future, only with computation. For the reason above, this work is composed of familiar instruments such as a window frame, a chair, and a plant at the exhibition place to make it easier to reproduce at one’s place. Furthermore, it basically does not require any special equipment other than one’s personal computer or phone, as those screens can be alternatives for the window.
Technical
This project was developed by p5.js. It talks to openweathermap.org using APIs to obtain the current weather data. The city list is in a JSON file preloaded to the main program separately. Every 30 seconds the program selects one city randomly from the list of 150,000 cities, and it then generates a new URL so that it can access that particular city’s current weather data. The output is drawn in the Chrome browser, and subsequently it is captured by the NDI scan converter, then passed to MadMapper to project the image inside the frame.
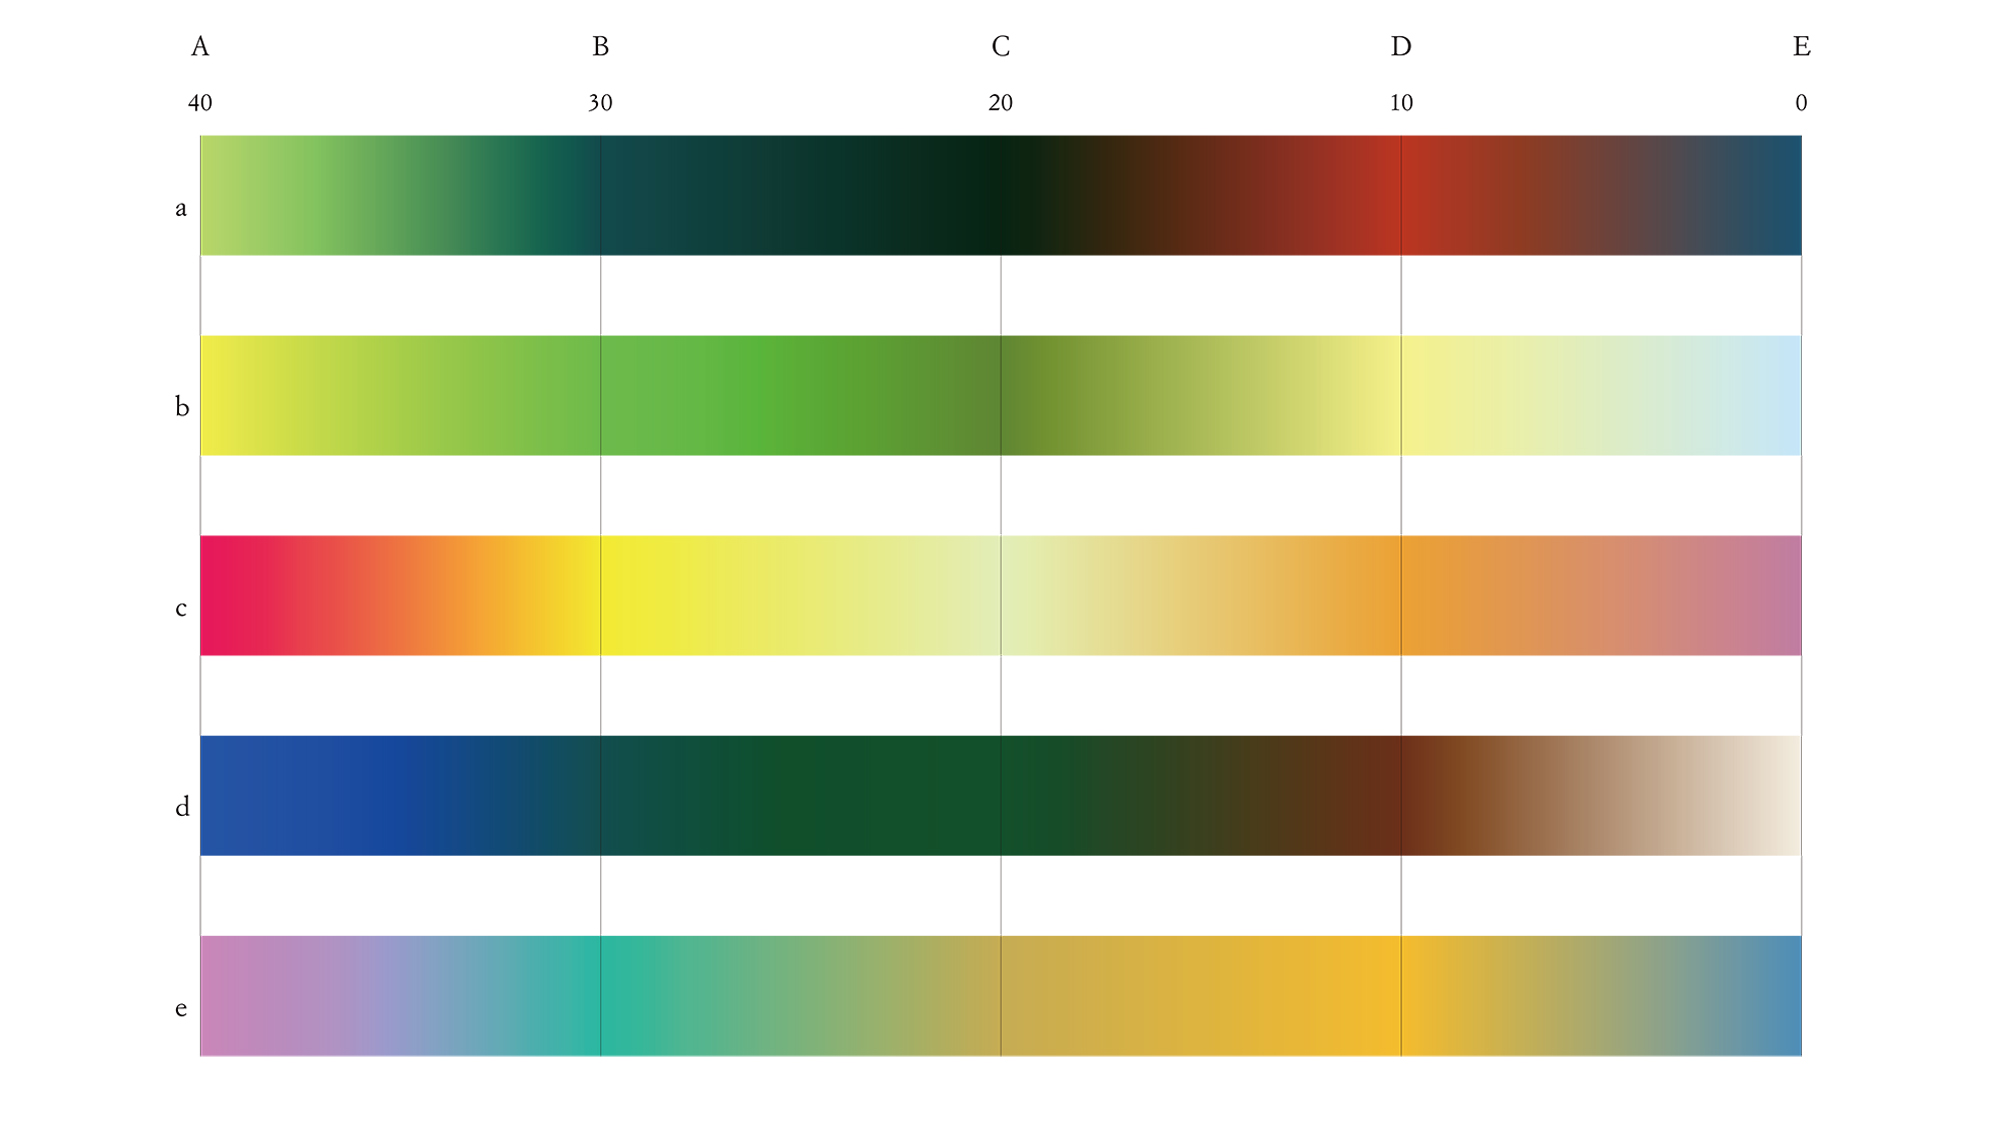
Colour
What I paid attention to most is setting the colours. Choosing the HSB colour system enabled me to handle the colours easier but was still not sufficient to create an effective transformation. First, I constrained the temperature between 0 and 40 degrees, divided it into four groups, then with the help of Adobe Illustrator, set the base colours for minimum and maximum degrees of each group. It was a fight with the capacity of my PC. The more detailed the colour I set, the more jiggly the behaviour. I found that five colours for each group were the compromise point, then used the lerp function to generate a smooth gradient between the minimum and maximum degrees.
Aside from technical issues, preparing a plinth unexpectedly gave me a big challenge. Having realized it was impossible to hang a projector from the ceiling as I was initially planning, I immediately ran to the store to get one and started painting; however, the material kept absorbing the paint, and it required me to repeat the painting. These experiences again showed me the difficulty of preparing for a physical exhibition. Additionally, in the process of creating this project, I learned how to prepare the developing environment. It was a fortuitous consequence that I could incorporate some frameworks such as iTerm, ohmyzsh and Visual Studio Code.
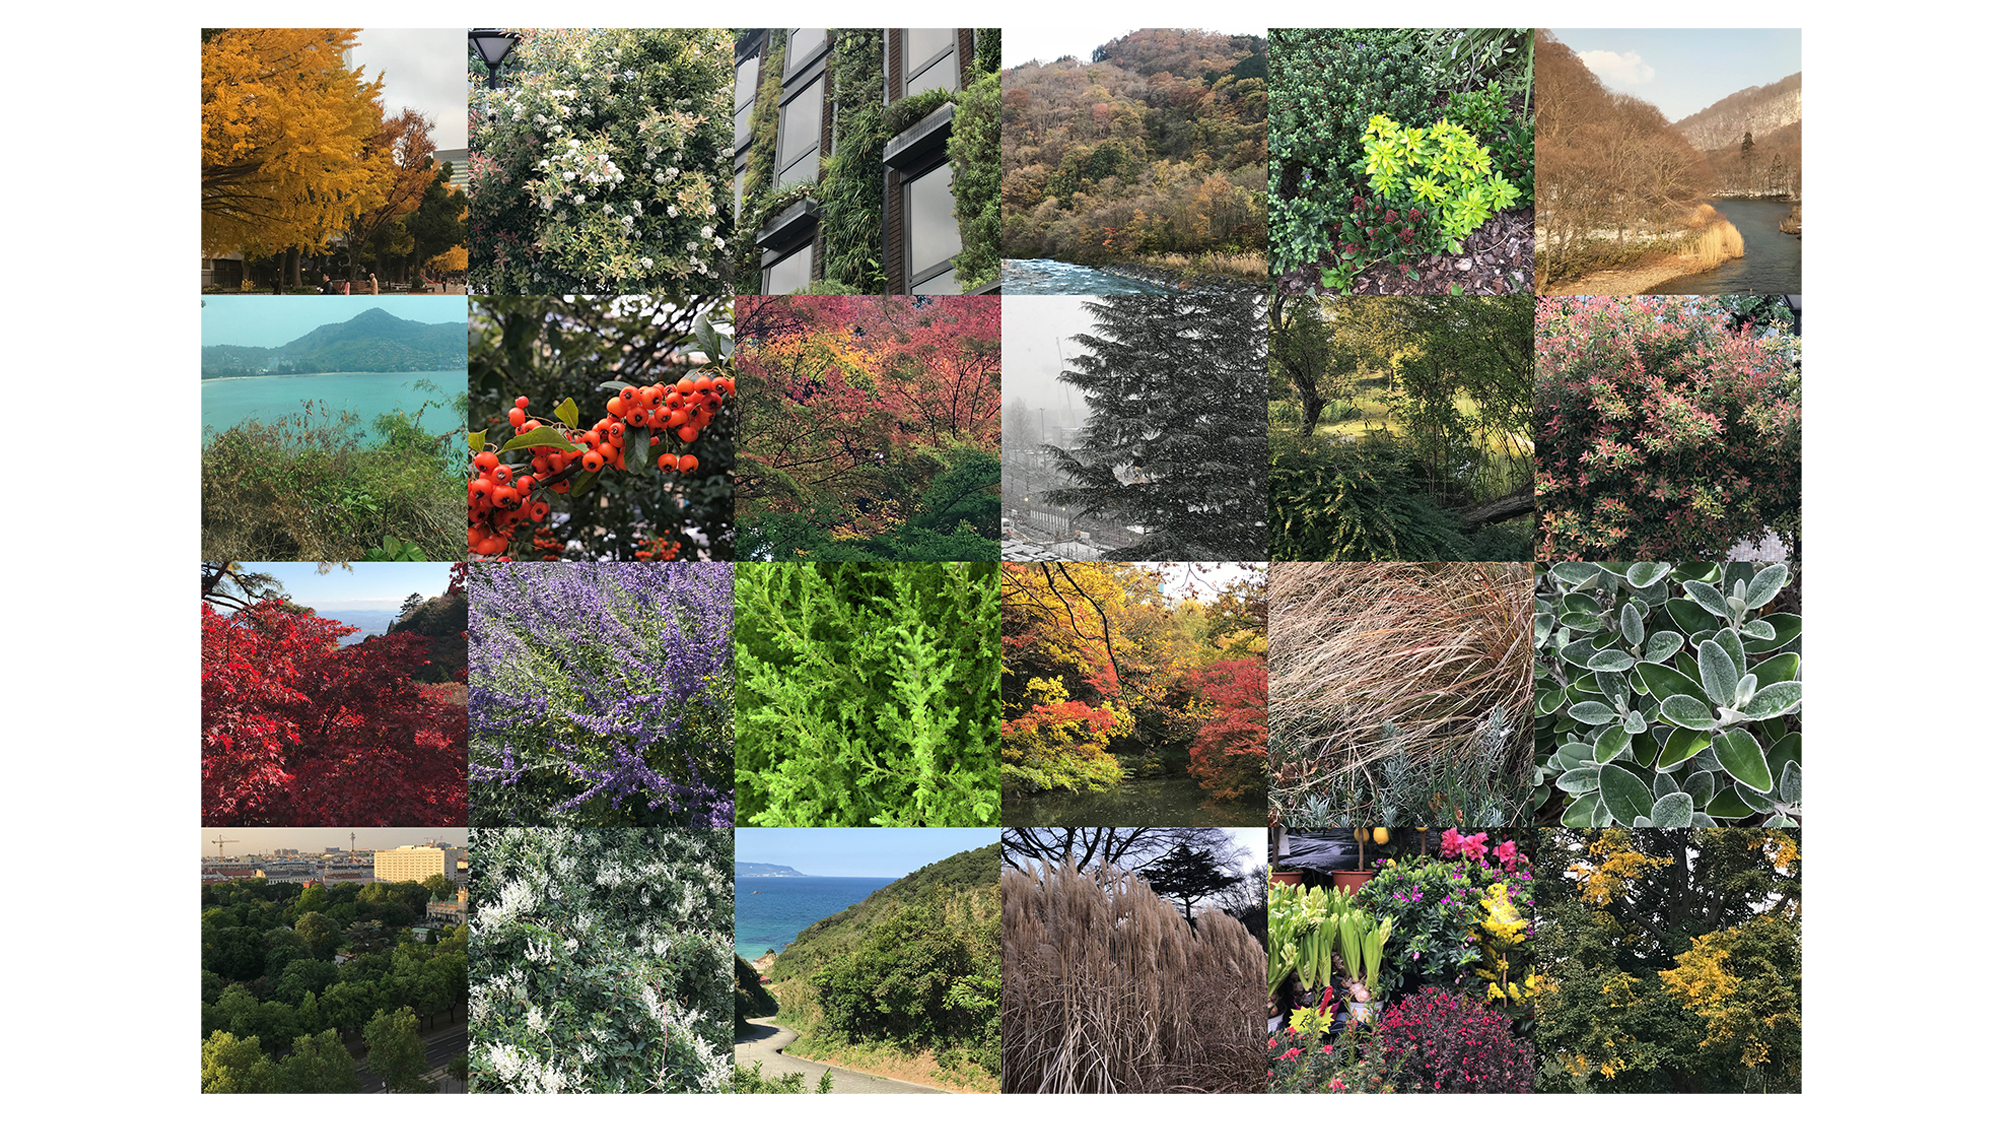
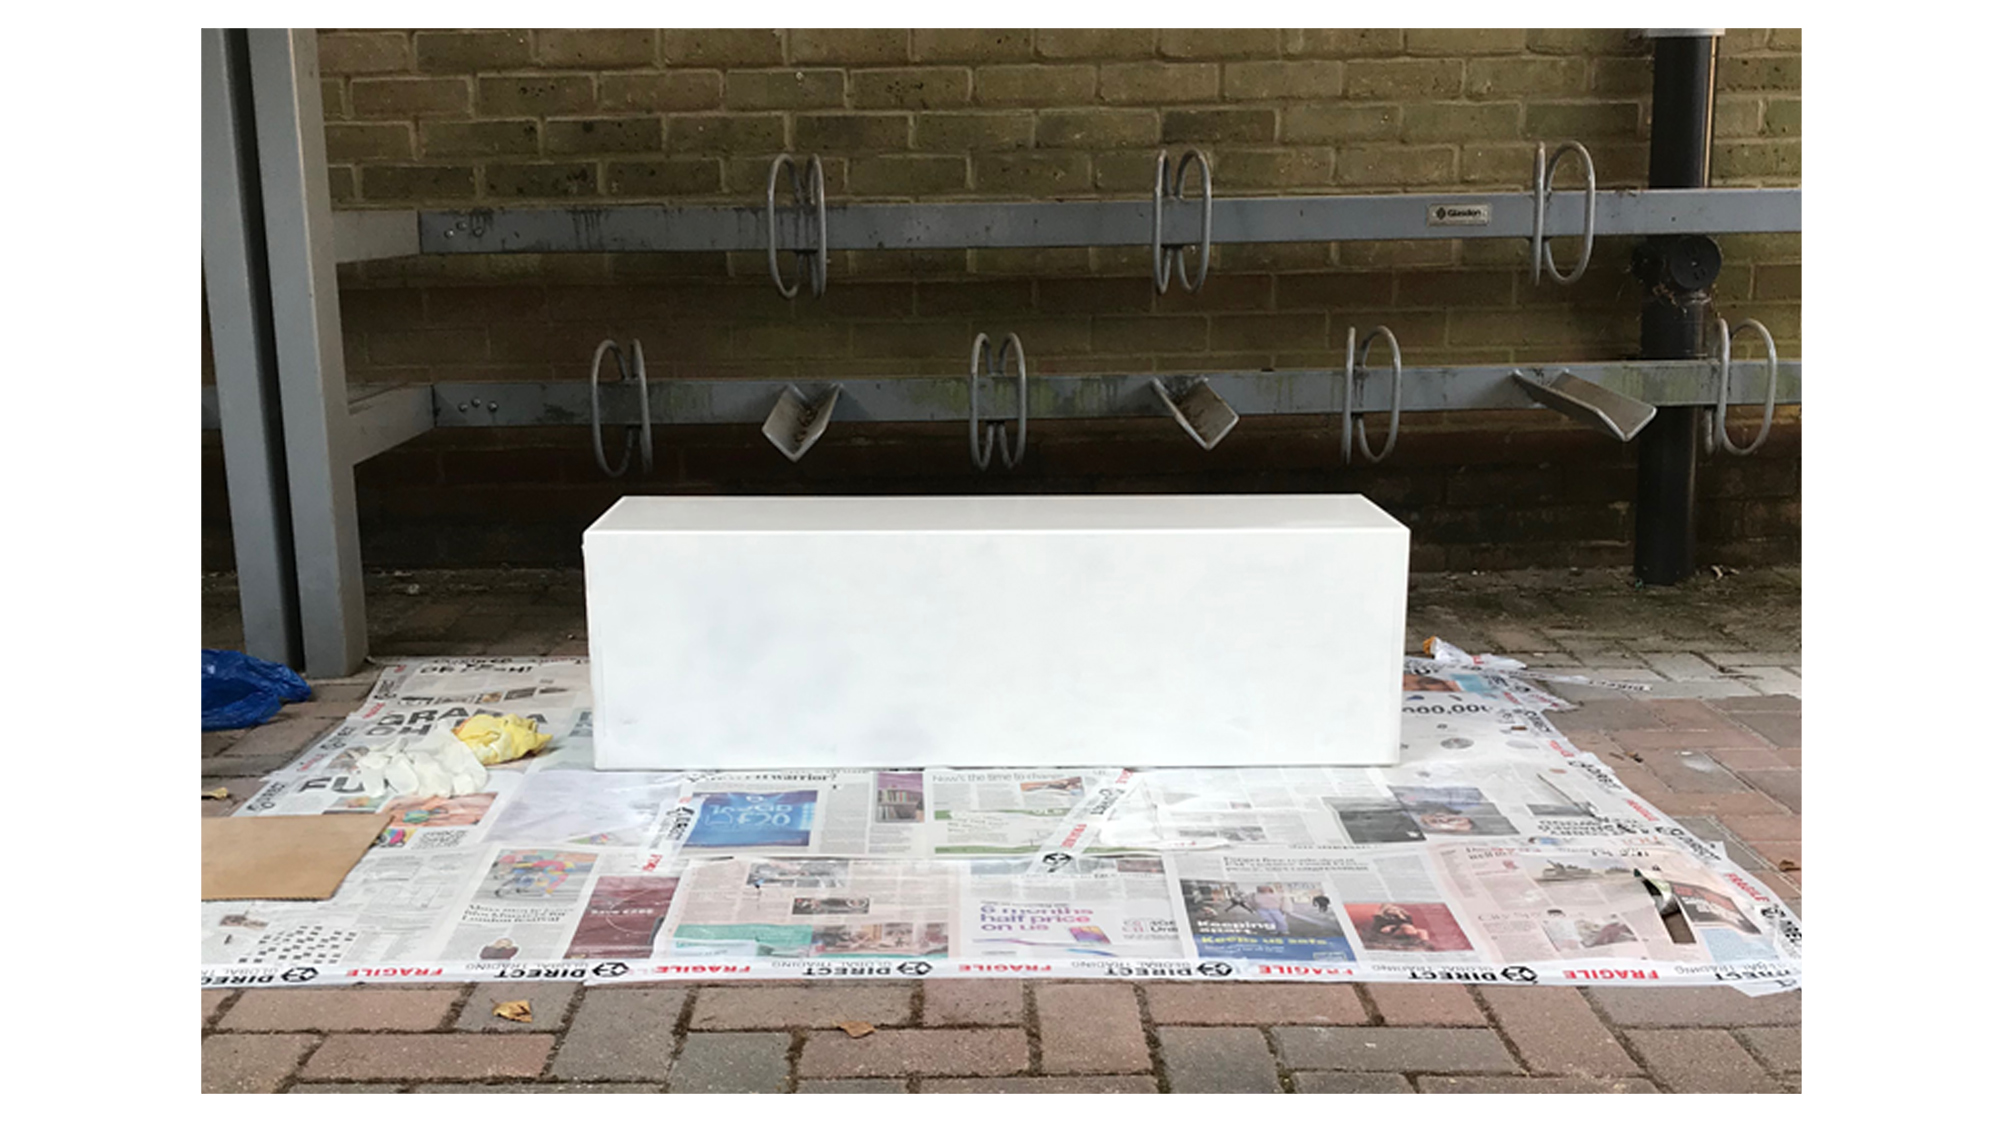
Setting colour | Gathering plant images to get a better sense of natural colour | Preparing a plinth
Future development
For further development, I would explore some additional interactions such as viewers can choose the city, or making the greenery’s direction of growth reflects the viewer’s movement by using optical flow. Adding another window for a map pointing out the location of the city that is being displayed would also be helpful in deepening the participant’s feeling of being on a journey. In addition, I enjoyed the process that numbers were getting meaningful by being given shapes. I’d definitely try to visualise another data set.
Self-evaluation
If I could have done this differently, probably I would have considered using a monitor instead of a projector as the output was subtle, resulting in poor image quality. However, overall I am content, as this project achieved the fundamental goal of functioning smoothly for the duration of the exhibition. This may seem like simple, but technical challenges of this project taught me to take nothing for granted. I evaluate my effort of preparing three different size frames to choose the best one and painted it with white colour to suit the wall led to complete the spacial presentation, making the most of the place I allocated, involving a fixed light switch on the wall.
References
(code)
Atsushi Tadokoro, media art programming 1 | https://yoppa.org/geidai-media1-20/11119.html
The Coding Train, 10: Working with data | https://www.youtube.com/playlist?list=PLRqwX-V7Uu6a-SQiI4RtIwuOrLJGnel0r
The Coding Train, 2018 Workflow: Editor, Shell, and more | https://www.youtube.com/playlist?list=PLRqwX-V7Uu6Zu_uqEA6NqhLzKLACwU74X
Reona396 | https://qiita.com/reona396/items/430ac01652897bfc4ef7
-----
浅野博善. (2017) プロジェクションマッピング技術を用いた仮想現実の仕組み.
Asano, H. (2017) Projection mapping gijutsu wo mochiita kasou genjitsu no shikumi.
Available at: https://www.youtube.com/watch?v=fxJmjKXIMAM [Accessed 27 September 2020].
Lieberman, Z., WeTransfer. (2020) Color Push. Available through: https://colorpush.wetransfer.com/ [Accessed 27 September 2020].
Munari, B. (1978) Artista e designer. 4th edn. Editori Laterza.
---. (2008) Design as Art. London: Penguin Books.
Nooteboom, L. (2017) Komorebi. Available at: https://vimeo.com/222447061 [Accessed 27 September 2020].
TeachableMachine.js Example: Hand Up/ Down. Available through: https://tm-wizard.glitch.me/ [Accessed 27 September 2020].
-----
*I would especially like to express my gratitude for information on a plinth from Nathan Bayliss, technical help from Rob, great photos and filming by Jonny, Catarina’s idea of placing a real plant and Christina’s advice for further development.