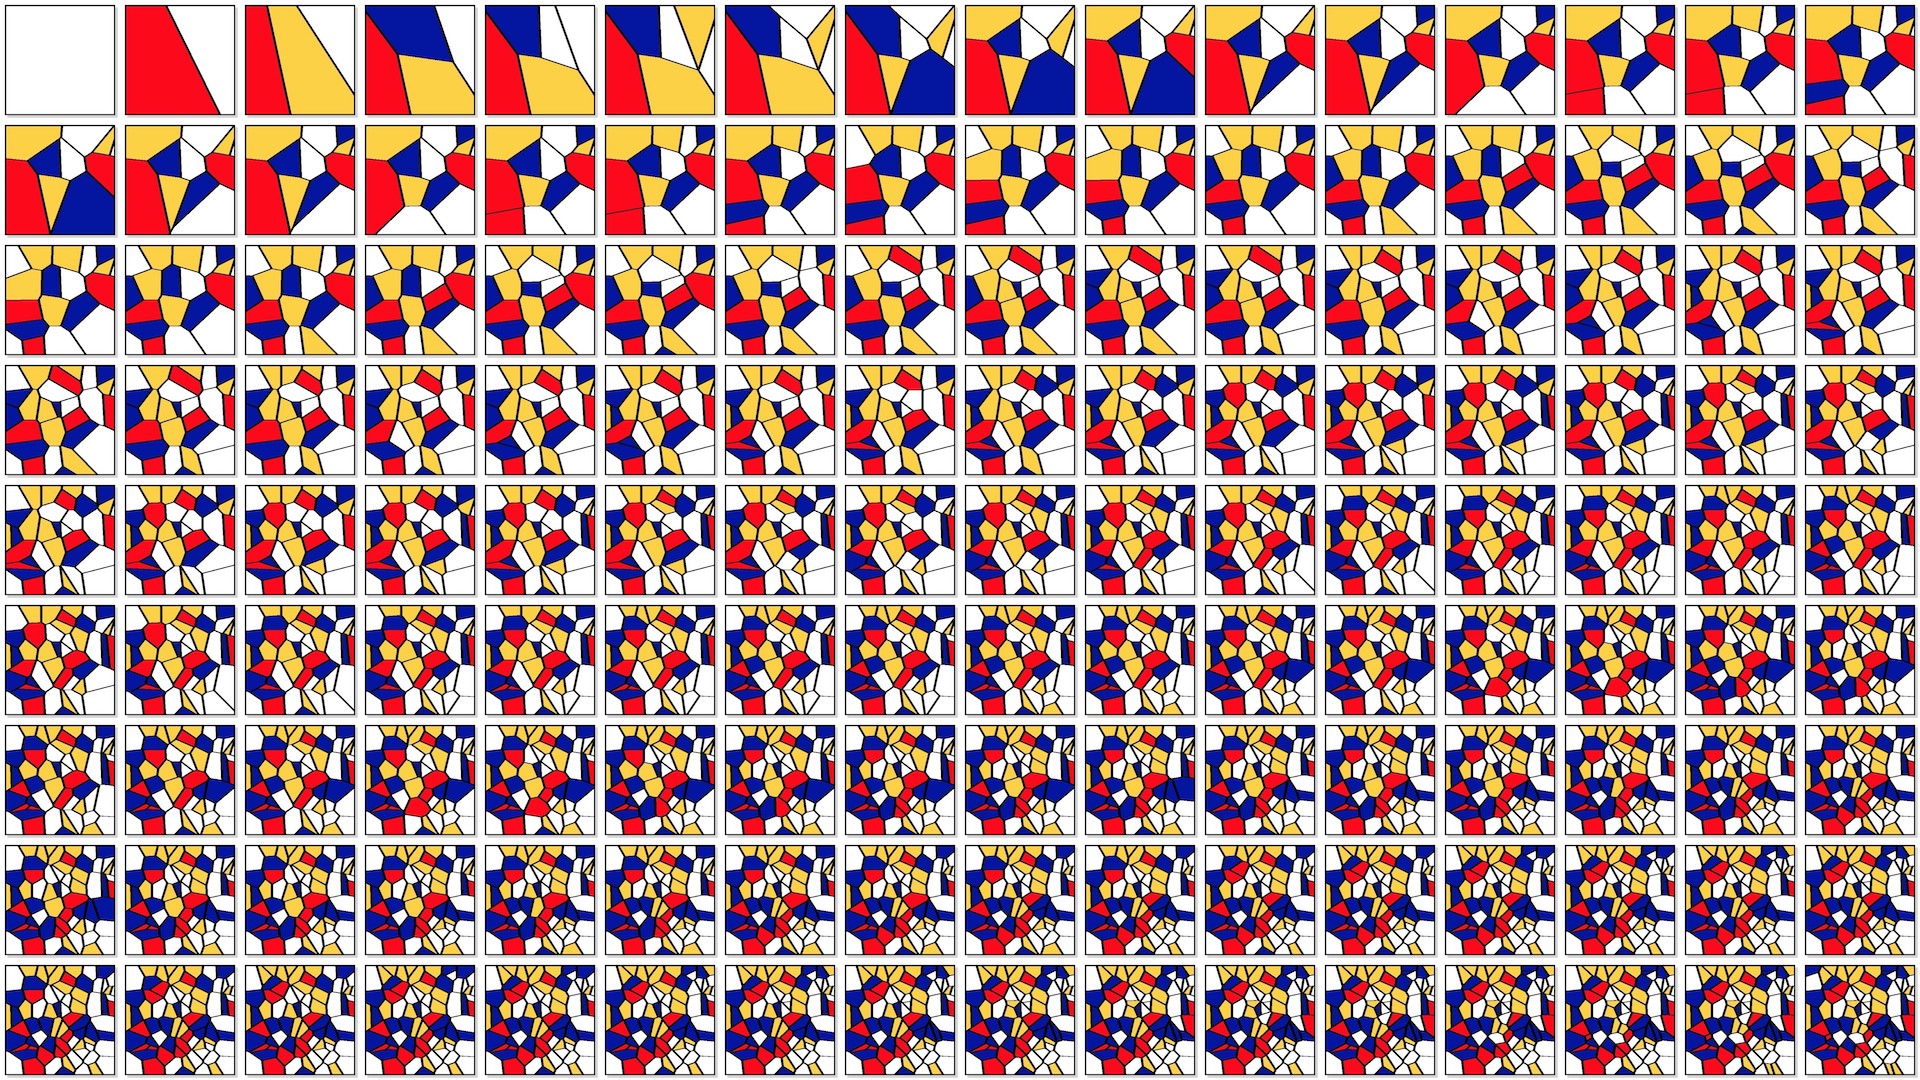
Voronoi Progression
This piece started with the idea of a journey or a route. A Voronoi diagram segments a plane into regions (cells) based on distance to specified point (a site). In robot path planning, the boundaries between Voronoi cells are used to find the safest route through an environment as they plot a path that is farthest from obstacles. The image makes its own journey in terms of complexity with a new site and cell being added in each subsequent square.
produced by: Claire Fleischmann
The first step in generating the image was store the locations of 144 sites as an array of objects – an array of objects rather than an array of PVectors was chosen as each site also has a grayscale colour associated with it to aid with the next step of the algorithm. I also explored using the latitude and longitude data for cities in the UK as the sites but felt that this was obvious in the final image and so returned to selecting site locations at random.
The second step in the process was to display the sites on screen and find the edges of the Voronoi cells. I initially started trying to implement the Fortune Algorithm but I found this challenging and as time was limited, I decided to use a ‘brute force’ method which sets a pixel colour depending on proximity to a ‘site’.
The third step looks for changes in pixel colour to identify the boundary between cells. One disadvantage in this approach was that working at the pixel level meant that the boundary lines were not smooth.
The fourth step was to style the output. The colours are inspired by Mondrian’s compositions with yellow, blue and red. The modulus function is used to decide whether to colour a cell red, blue, yellow or white. The black boundary line separating the cells was also widened.
The fifth step was to assemble the final canvass. As my algorithm used a pixel-by-pixel scan of the image to locate boundaries, this required me to treat each individual square as a separate image in an off-screen buffer. The program runs the algorithm for a single site and then positions the resulting image on a grid before adding a site and going through the process again. A total of 144 sites are added sequentially to 144 squares.
The final print is printed by www.digitalarte.co.uk on Hahnemühle Photo Rag 308gsm (smooth matt finish)
References
Voronoi region code adapted from Ben Chun (https://www.openprocessing.org/sketch/8130)