


T1
T1 is a static installation exploring the chronology of a state of being as a type one diabetic. The project utilises biological data collected over four months, and re-imagines that information through creation of a new, personal hieroglyphical language.
produced by: John Dore
Introduction
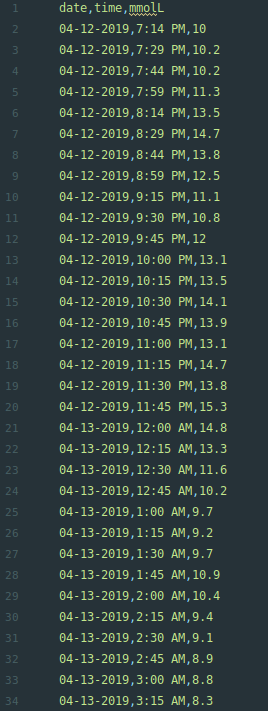
The T1 installation is centered around the pursuit of knowledge, and the way in which information can be re-imagined aesthetically to either provide or encode understanding. Utilising methods and approaches rooted in computer science, biology, mathematics and philosophy; this project pivots around traversing unfamiliar territories for the sake of temporary illumination. The data informing T1 was collected over a period of four months via a sensor attached to my arm, which uses new bio-engineering technology released in the UK via the NHS, to record blood sugar levels every 15 minutes. Using NFC the user can scan the sensor with their phone for instant readings. This sudden plethora of data is informing both medical professionals and diabetics in new and profound ways. T1 has become a chronological journey in which I developed an individual hieroglyph to represent each integer range (blood sugar level), thus exploring the relationship between data and representation, as well as my own understandings of self. Thus in time, numbers that once instilled disappointment, disillusionment, relief or regret ended up becoming codified symbols in a newly evolving personal language. I programmed these glyphs in Java/Processing and plotted them with an axidraw V3/A3 machine, in both scroll format and six individual A3 drawings. Overall, T1 is the beginning of an exploration into my own state of being at any given time.
Concept and Background Research
Living with type one diabetes means that everyday physical activities such as eating, drinking, sleeping and exercising; and psychological states of being including stress and anxiety directly affect my biological capabilities to function. Whilst a non-diabetic person’s blood sugars will usually range between six and eight, my blood sugars can range anything between one and thirty. The manual operation of injecting insulin and monitoring my sugars to replace the automatic functions of a working pancreas is a continual challenge, and one that has greatly evolved since the release of the Libre Sensor by the NHS.
In scanning my sensor with my phone in day-to-day life, the number appearing on screen has a certain amount of control over my wellbeing. In collecting this raw data, I was able to re-codify it in individual symbols that are emblematic of my physical and mental wellbeing throughout any one period of time. What appears to the viewer to be a systematic grid of hieroglyphs, reads to me like a journal of my ability to replace a dysfunctional organ and care for myself. Carl Rogers wrote that “a person is a fluid process, not a fixed and static entity; a flowing river of change, not a block of solid material; a continually changing constellation of potentialities, not a fixed quantity of traits.” T1 is exploration into re-imagining this concept based on biological flux, in order to gain personal insight and develop a new, highly aesthetic language.
Installation
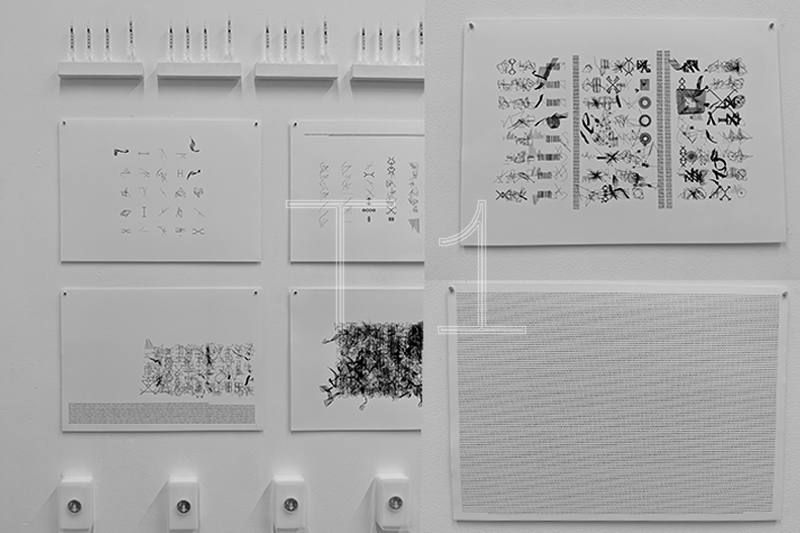
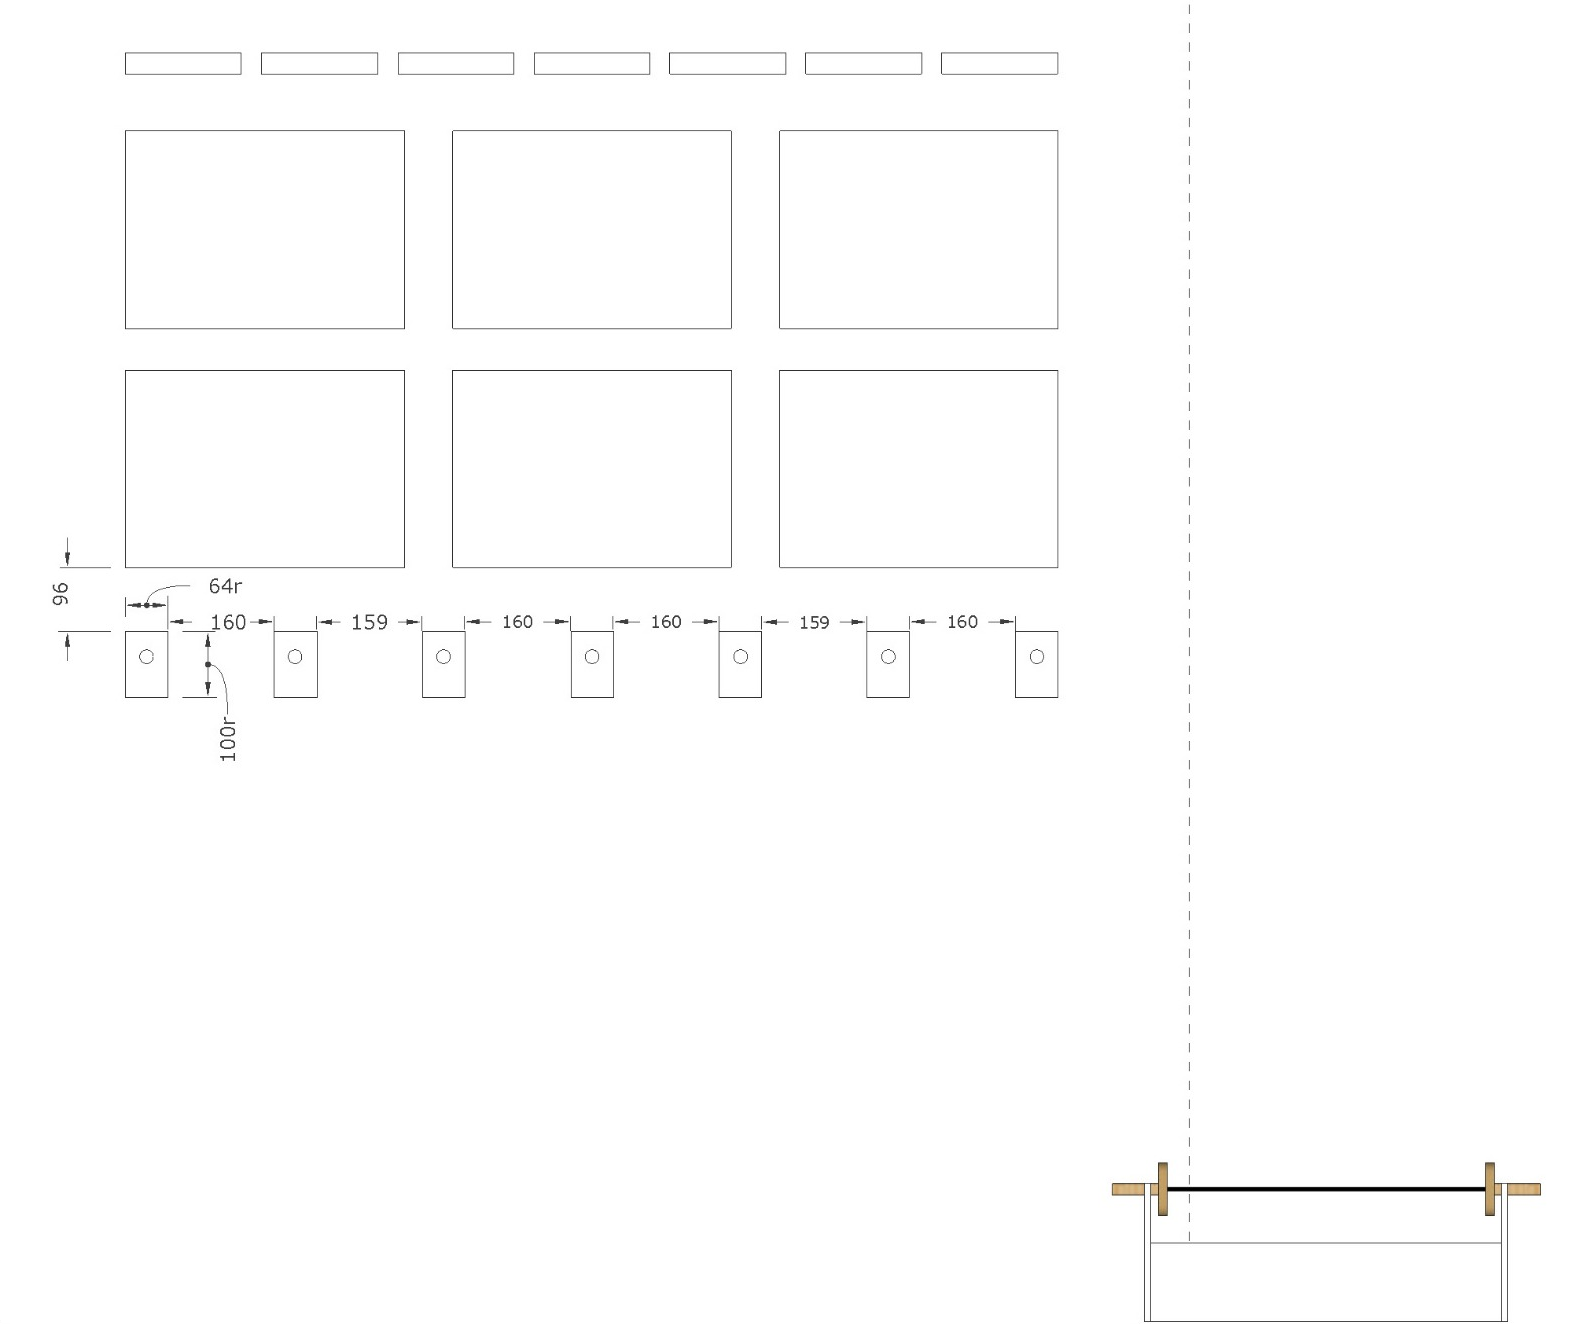
To the untrained eye, I wanted the installation to be immediately aesthetically gratifying. The relationship between art and meaning is often complex, and I intentionally used a minimalistic set-up to encourage intrigue, but not force the viewer to become a student of biology if they simply wanted to appreciate the design. Upon closer examination, and with the aid of the written summary, it could be discovered that the top row of objects were mounted needles, with which I was injected with insulin as a child. I gradually incremented the needles in height in accordance with the increasing amount of insulin needed to live a healthy lifestyle as I grew up. Across the bottom of the installation I mounted the sensors, taken directly from my arm after they expired and stripped of their adhesive sticker to reveal their inner mechanics.
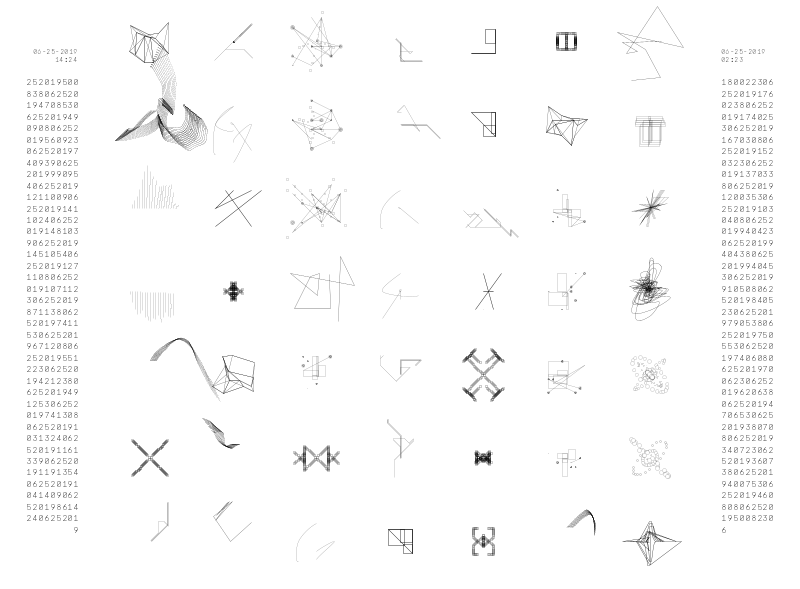
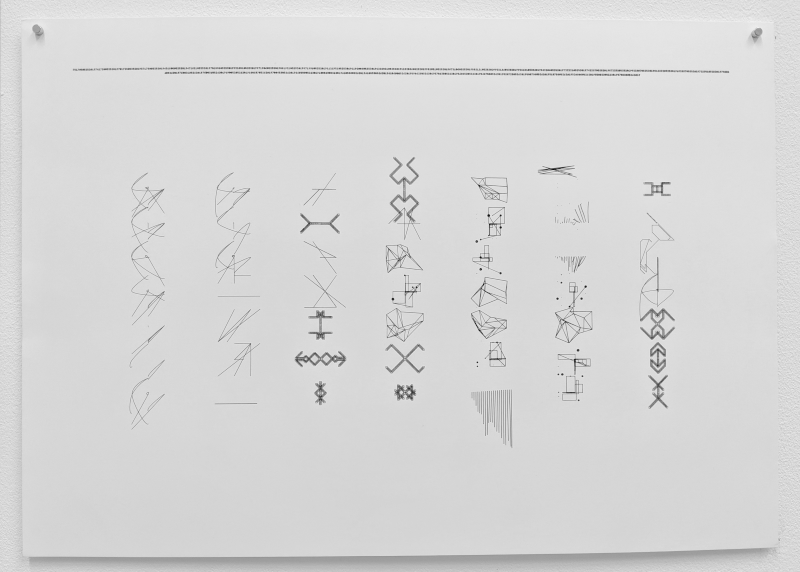
Hanging the full length of the wall on the right was a scroll. I broke it into sections, each one representing approximately twelve hours. In the first section, there is a grid simply containing numbers – one number (blood sugar integer) for every fifteen minutes. As I began to create symbols to represent each sugar range, a process of reflection regarding the appropriate aesthetic representation of a physical state of being (that most people cannot experience) occurred. The scroll gradually became more detailed, with the eventual outcome that every number was replaced by a symbol. As a rule of thumb, the higher the number - the more complex the symbol becomes. The necessary methodology I employed here allowed me to explore territories of language, memory, trauma and aesthetics; the overall output taking shape as a personal language of hieroglyphs. After several sections, I decided that I wanted to include the raw data as part of the overall image, but in such a way that did not explicitly de-code the symbols. I formatted the data so that each glyph was directly associated with it in the following format: blood sugar-time-date.
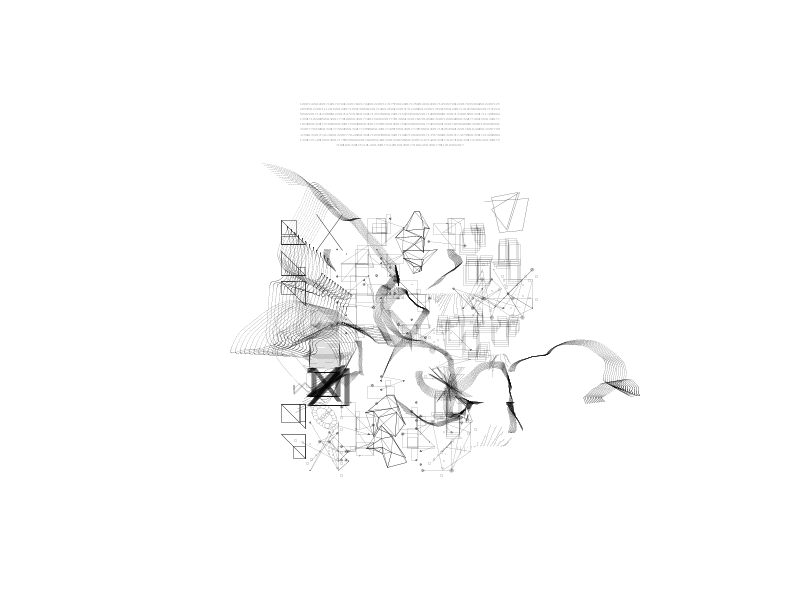
The central and final part of this installation, is six A3 drawings. The first five each represent a month between April and August, and I extracted a cross-section of data varying in size for each drawing. Creating an image that represented my blood sugar levels in April was a lot less traumatic than considering my current biological state in August; thus they become chronologically more aesthetically and technically chaotic, reflecting one’s ability to process experiences more clearly with time and distance. The final drawing is an accumulation of all of the data I collected for the installation, the bare, unadulterated figures that represented my state of being over this period of time.
Technical Specification & Future Development
T1 was written in Java and relies heavily on importing Processing as a library. The overall design utilises gridded layouts in order to present the visuals and also in some cases design the glyphs themselves.
During the initial design stages of the project it became apparent how maintaining some type of order would be problematic if I was going to be making a class file for each glyph design. When using the default processing IDE or a text editor like vscode/atom, processing simply looks for classes as .pde files of the same name within the folder, which simplifies ease of import but passes up on the Java package convention - which ultimately functions as an invaluable organisational paradigm. After realising this I managed to modify and refactor my code so it ran as a Java project, the IDE I opted for was JetBrainz Java IDE intelliJ. When using processing as a library there are a few extras I learnt to deal with - Class Access Modifiers are required (public, private etc):
- The class that you pass as the entry point in the JVM main method must extend the base processing class PApplet.
- A reference to the parent PApplet you want to use must be passed via it's constructor.
1. public class TypeOne extends PApplet{}
public static void main(String[] args) {
PApplet.main("TypeOne");
}
2.
// local class PApplet object declaration - this inherits parent
PApplet ps;
public Glyph8_9(PApplet parent, int wi, int hi) {
ps = parent;
w = wi;
h = hi;
}
The data is loaded from a large .CSV file that was exported from the Freestyle Libre dashboard (LibreView). I did modify the .CSV formatting, and have noted that for future development I plan to write a python script that formats other people’s LibreView files to function properly with T1, without having to edit it manually. This data is loaded into objects accordingly during the setup method of the TypeOne class.
The GlyphBundle object binds time, date, and mmolL (blood sugar) to an object and then based on the range of the decimal value of the glucose reading it creates the appropriate glyph object. In order to align the grid location positions and make the application dynamic to the size of the canvas, multiple data structures were required. At the heart of the data management, an ArrayList of GlyphBundles utilises a behavioral design pattern known as the Command pattern, (which can read more in depth about from the link below) [https://en.wikipedia.org/wiki/Command_pattern] which I used to encapsulate the render and initialisation methods for each glyph.
All of the images generated with T1 were plotted using an Axidraw V3/A3 (link below). Within T1 the 'r' key is bound to a key pressed condition that saves a .pdf file. I then converted the resultant .pdf file to an .svg using inkscape. At this stage, I ran the svg file through Anders Hoff's [svgsort](https://github.com/inconvergent/svgsort), this optimises plot timing by measuring distance and centres and resizes if necessary. There is also an Axidraw plugin within inkscape that does a similar process. I plotted the sample prints on A3 Canson bristol board, using a 0.10 Rotring Pen with black Rotring Ink, and the scroll was plotted using a muji 0.25mm hex ballpoint on a 30m roll of Chinese Mulberry Calligraphy paper.
The visual nature of the glyphs are inspired by my initial research into generative systems, physics simulations, randomness in conjunction with systems of connected nodes, and Ancient writing systems (Cuneiform, Hieroglyphs etc). When a glyph is selected based on it's blood sugar value, various amounts of (pseudo)randomness come into play. In essence when Glyphs fall into the same range, it's highly unlikely they are exactly the same - yet as characters of an alphabet appear different when written by the hand of an other, they still hold the same meaning.
I aim to continue this project until the scroll is full. As time permits the designs of each Glyph will evolve and become increasingly more unique. I would like to design a universal way in which the floating point value of a sugar level could be embedded or utilised by each Glyph. Beyond this project, I feel as though the realm of plotting computer generated paths as drawings or paintings in the real world gives a sense of breaking away from the frailty of code. I find the idea of building a plotter that can move as a free agent across the surface of a much larger canvas an exciting prospect and will be continuing research in that area.
Self-Reflection
This project has been the beginning of an exploration into my continuous state of being. The personal nature of T1 has opened up new territories in areas such as language, representation and health which I am excited to pursue in the future. Whilst with more time and resources I could have scaled up the installation, and would have liked to explore the possibility of creating a moving scroll holder to showcase the full length of that piece, I was overall satisfied with the aesthetic output and introspective process I embarked upon along the way.
References
[John Dore](https://johndore.github.io/) - T1 Github Repo coming soon
[Processing](https://processing.org/)
[IntelliJ](https://www.jetbrains.com/idea/)
[Google .XML Java Formatting convention for IntelliJ](https://github.com/google/styleguide/blob/gh-pages/intellij-java-google-style.xml)
[Inconvergent](https://inconvergent.net/) (Anders Hoff)
[Nature of Code](https://natureofcode.com/) (Daniel Shiffman)
[soogbet](http://soogbet.net/) (Lior Ben Gai)
[Manfred Mohr](https://www.emohr.com/)