


Generative Voronoi Diagram
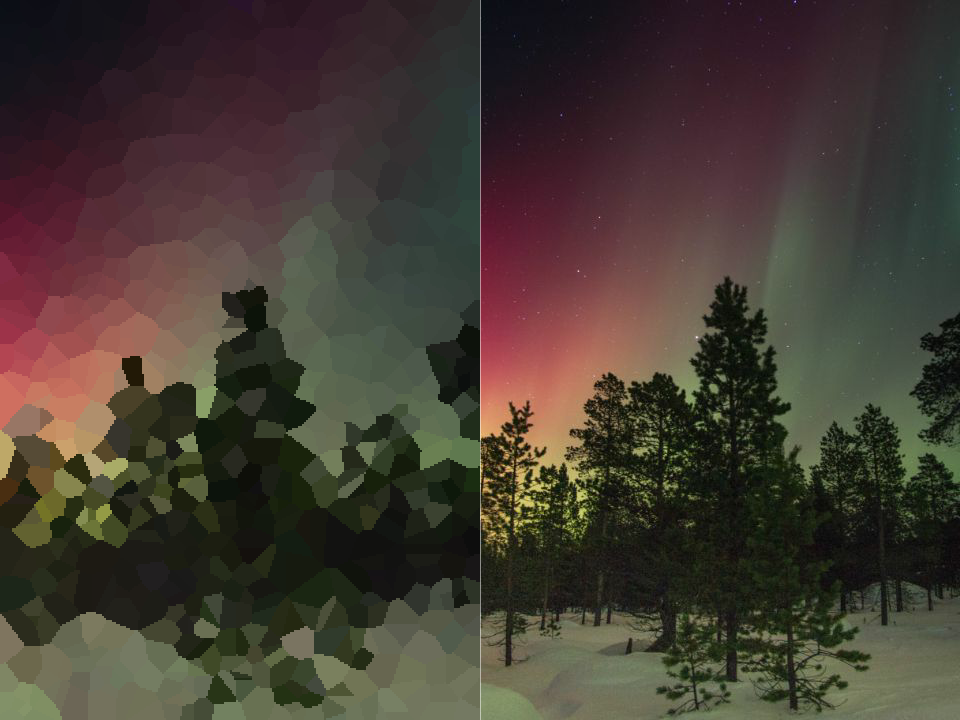
A program demonstrating a simple algorithm to create a voronoi diagram from a selected image. Output ranges from blocky pixel art to detailed geometric mosaics resembling the original image.
Produced by: Andrew Thompson
Project Description
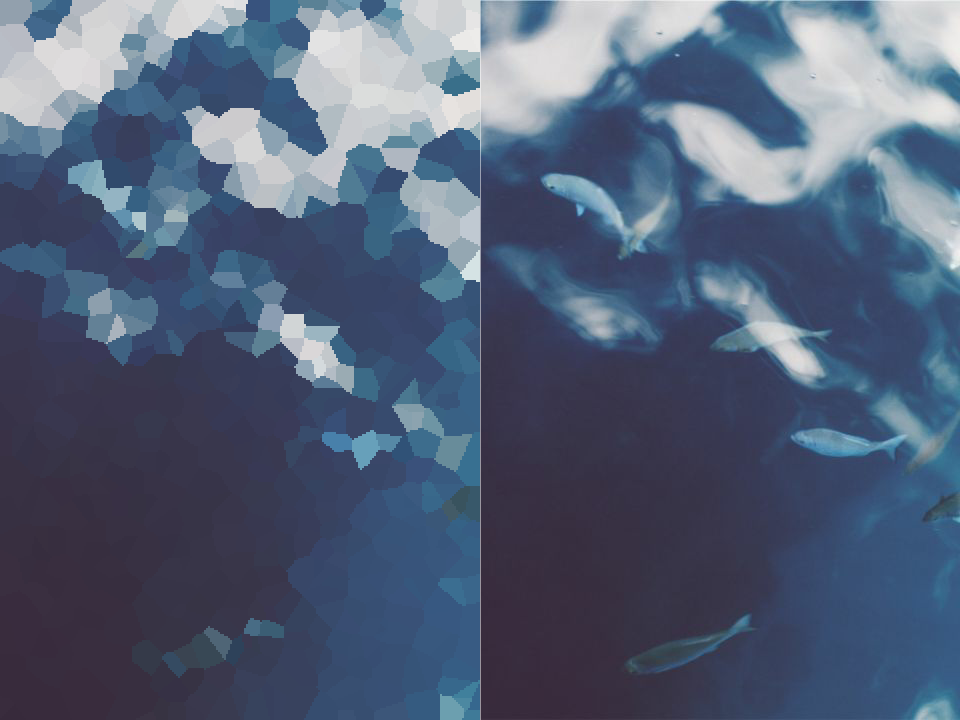
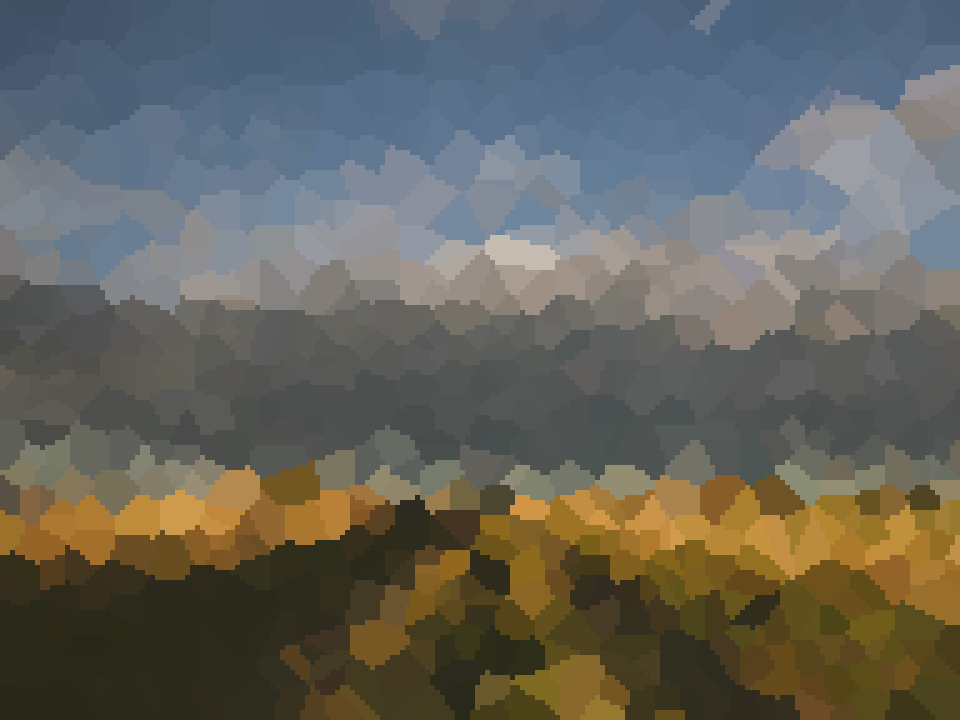
Inspired by low-poly and geometric art, I sought a way to generatively produce such style based on an input image. I discovered two main ways of algorithmically achieving such result: the Delaunay triangulation, and creating a Voronoi diagram. The Delaunay triangulation produces the more 'traditional' aesthetic, generating an image comprised of triangles in the same way low-poly 3d models are produced by a small number of triangles. I however opted for the Voronoi diagram, whose method produces irregular and interesting geometric shapes to form in the image.
There are a number of efficient algorithms for producing a Voronoi diagram, including some that start by performing the Delaunay triangulation. This is because both processes are mathematical duals, that is, the represent the same data and thus can be converted to one another. For this project however, I have implimented a simple brute force method which came with its own set of challenges.
As points are added to the vector, their position is randomly generated. Part of this generation involves checking if the new point is too close to an existing point, if it is this point isnt added to the vector and a new point is recursively generated. Points can be generated either by calling Voronoi::addPoint() or Voronoi::addPoint(int num), this is called an overloaded function. An overloaded function is a method of defining multiple functions with the same name, in this case addPoint. Doing so allows us to control the behaviour of the function if it is supplied certain parameters. By default addPoint will generate one new point to the vector, but as we can see by supplying it a number of points to generate, it can generate multiple points in one go.
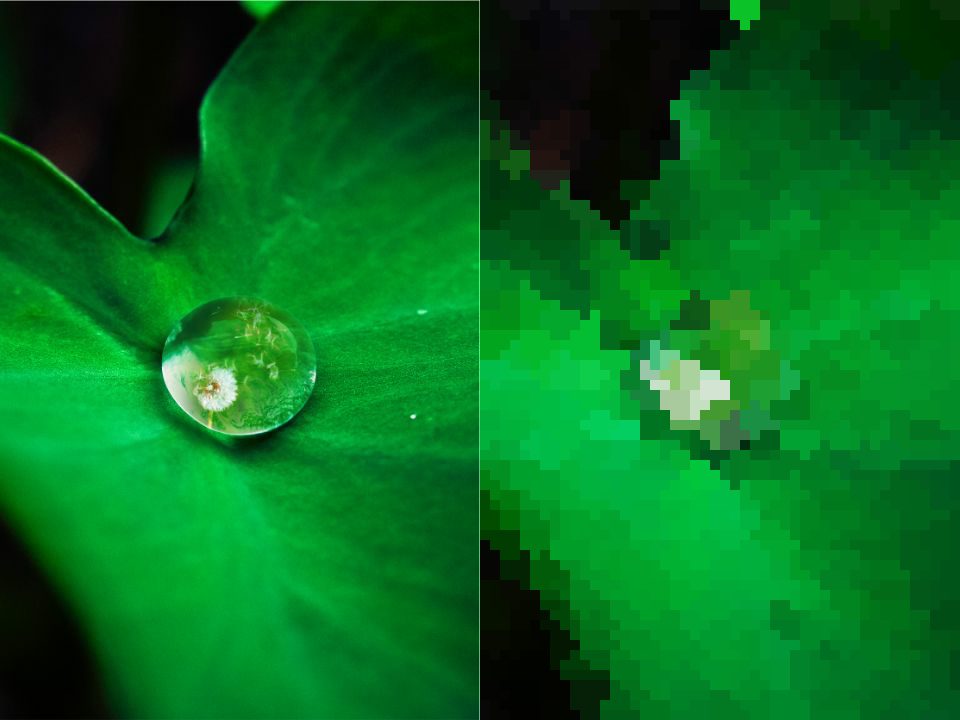
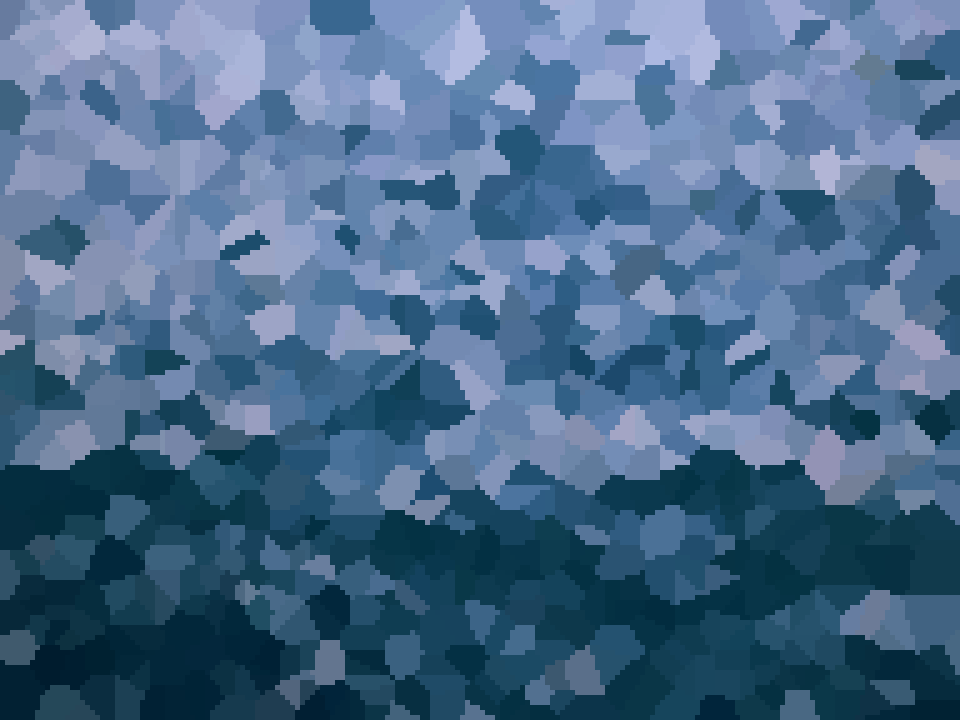
A mentioned previously, the Voronoi diagram is generated through a brute force method. That is, every call to Voronoi::update() cycles through every pixel and determines which point is closest to it, then assigning the colour of that pixel to the colour the closest point. I have devised two methods to optimise the process. The first is a simple scaling of the input image. Scaling the image down means the program has to check the distance from each point to every pixel fewer times as there are fewer pixels. If you consider a 100x100 image has 10,000 pixels, yet a 200x200 image has 40,000 it quickly becomes clear that scaling the image down drastically reduces the computational load. Performing this scaling however, has an interesting aesthetic effect; producing a pixel art aesthetic. This is because the Voronoi diagram is essentially scaled back up to the original resolution, creating a blocky square pattern.

My second method utilises multithreaded processing to offload the calculation to another thread, freeing up the main draw thread. To do so, the Voronoi class extends the openFrameworks base class ofThread, and the Voronoi::threadedFunction() is written. While the thread is running it continuously runs Voronoi::update(). While this does achieve the goal of freeing up the main thread it produces an interesting effect when larger images and high point counts are being processed. While the canvas is updated every frame, the algorithm certainly slows down far below the frame rate. The result is a left to right sweeping motion as the new points are drawn while they're being calculated.
References and further reading:
https://en.wikipedia.org/wiki/Voronoi_diagram
http://donhavey.com/blog/tutorials/tutorial-7-voronoi-diagrams/
https://www.openprocessing.org/sketch/61968