


CONNECTION
What does the world look like in the eyes of different people?
Mountains, oceans, forests, cities, all kinds of different substances constitute the world we live in. We breathe the air, touch nature and feel different emotions from connecting with different people. We live in this world, and we are also being monitored and being a part of this world. I don't know if anyone will have this question: each one of us is an individual in the hearts of our own family and friends, a unique existence. But in the entire social environment, we may be just a set of data or a number.
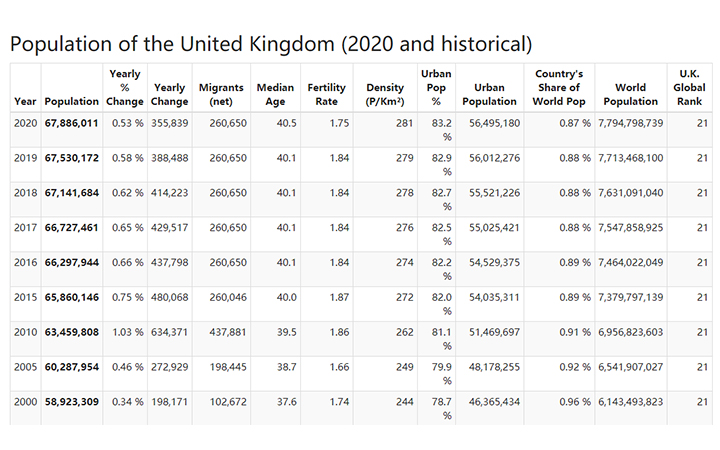
We are a number in the census.
Introduction
Everything that exists on the earth is planned and analyzed by human beings. The waves of the ocean, the ups and downs of mountains, the concentration of air, the distribution of cities. In the process of creating this work, I tried to give answers to each set of data, and also tried to find the connection between each set of "data" and each (or group of) substances that existed on the earth. On the other hand, I am also thinking about the connection between the data-based "environment" and the "environment"
Concept and background research
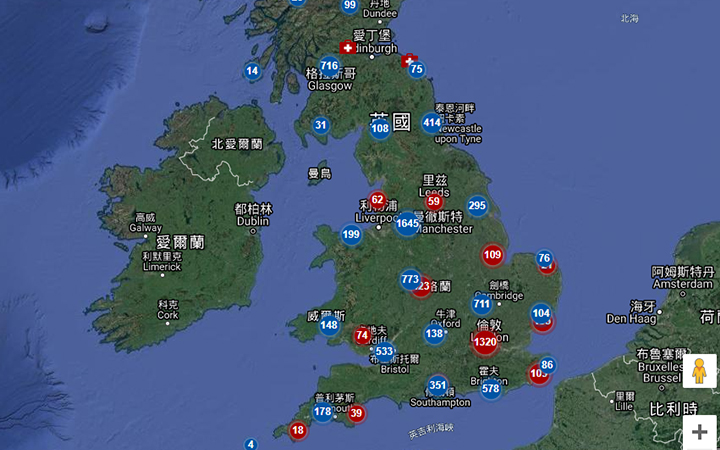
Our first impression of the surroundings might be the mountains, rivers, cities, etc. that we see by our eyes. But when we think about all environments that are digitized, what we think of might be the length of the waves, the density of the urban population, or the data that satellites bring us all the time. These different perspectives caused by different starting points motivated me to search for this connection. And in the end, I thought about and constructed this connection with structuralist philosophical theory.
In the theory of semiotics, Roland Barthes interprets signifier and signified as "expression"(E), "content” (C), and the relationship(R) and call that: ERC. In general ways of symbol system, "expression"(E) and "content” (C) can make significations under their relation(R) and form a plane(ERC). For example, when we explain the ERC system of “urinal”. E is the object “urinal” and C is the function and practicability of urinal. E is associated with C and forms its function and meaning with R to create a plane ERC.
Through structuralism, there are two different distinctions between the environment around us:
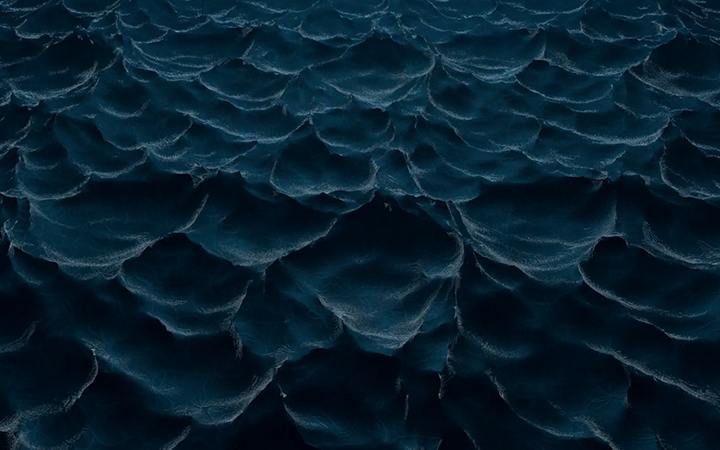
In the environment in our eyes, "the word ocean" corresponds to “the thing like ocean".
In a digital environment, "the word ocean" corresponds to "all data corresponding to the ocean".
As for the data-based environment around us, there is a very critical question: is the data-based environment directly generated by the "content level" or do we first think of "pictures of the ocean, things like the ocean", and then think of the resulting "All the data"? Is the "environment" we see and the "environment" under data analysis the same thing?
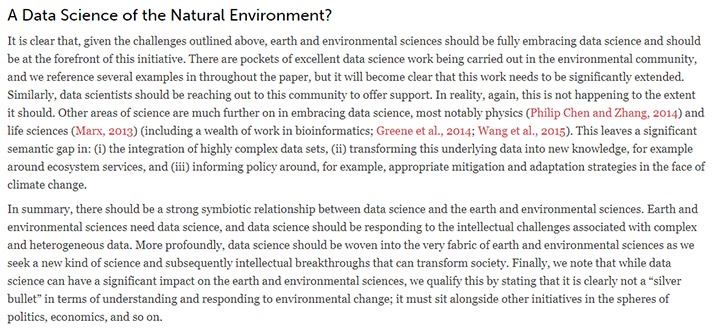
It is written in the article“In summary, there should be a strong symbiotic relationship between data science and the earth and environmental sciences. ”。
That also means that the data-based "environment" and the "environment" we see are actually not different result from the starting point, but two different ERC systems.
In order to explore the reasons for the distinction between these two in structuralism, I used the perspective of "metal language" to analyze their differences.
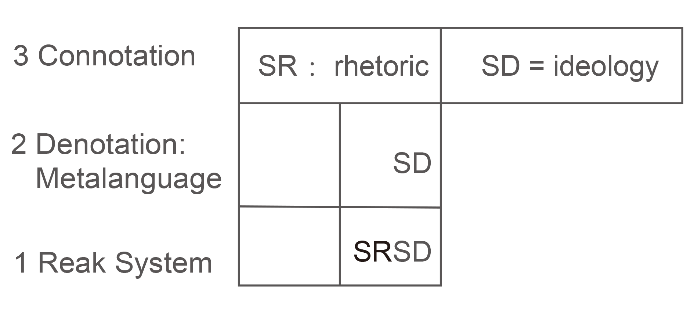
Back to the urinal just now. If one day the urinal we saw was put into an art gallery, such as Duchamp, then the urinal suddenly became a work of art. The reason for this situation is that ERC has carried out a systematic extension,if the ERC have a denotation plane which seems like move urinal to one museum that the first system becomes the simple elements of the second system and forms two completely different entities. In this expression, the first ERC becomes the second ERC expression layer (or signifier) which has the following structure:
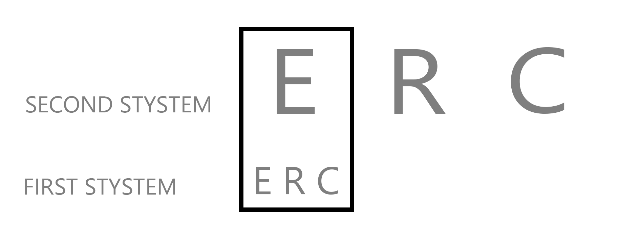
The first system in this system is called the denotation plane by Roland Barthes, and the second system is called the connotation plane. The artistic significance of duchamp's “Fountain”(urinal) is its connotation. In the other case, the ERC in the first system is replaced by the content plane or signified of the second system from the denotation plane of the second system.
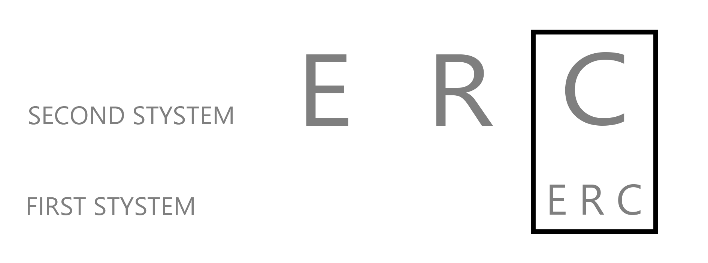
This type of system forms the metalanguage structure -- the symbolic structure that interprets content(C), such as semiotics, art, science which is an operation used to interpret other content. If the urinal is explain by using art as the metalanguage will lead an new structure with the metalanguage denotation, and its structure will be:
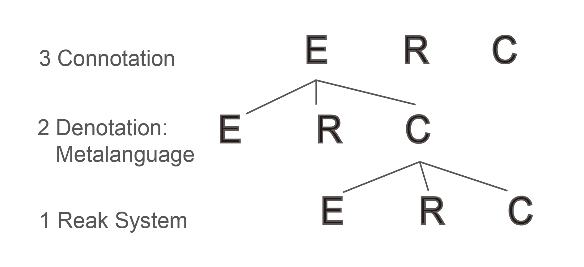
It can be seen from above that both connotation and metalanguage are based on the structure of E and C. However, due to the difference between the original C, the "data-based sea" and the "sea", these two produced completely different metalanguage. The addition of data can be analyzed and dissected by humans in a "data-based environment".
I have obtained all the differences and connections between "environment" and "data environment" through Roland Barthes's theory:
The symbiotic relationship born under different metalanguage. The "data environment" can be analyzed by humans, and the "real environment" can be seen by humans.
This conclusion has also become the starting point of my creation: creating a set of "real environment" and a set of "data environment". And show their symbiosis and differences -the data environment can provide feedback through human behavior, but the real environment cannot.
Technical
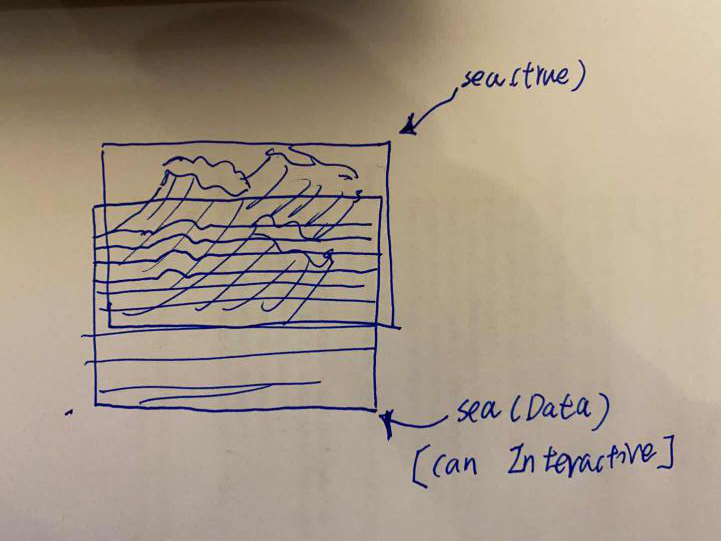
This is my first sketch with two screens superimposed. Two projectors projected at the same angle, the first screen is transparent, and the back screen can be seen through the first screen. The front screen can interact with people through Kinect, and the back screen recorded ocean video. Then I chose five things in our surroundings to create: oceans, mountains, cities (propagation), machines representing technology, and universes representing space.
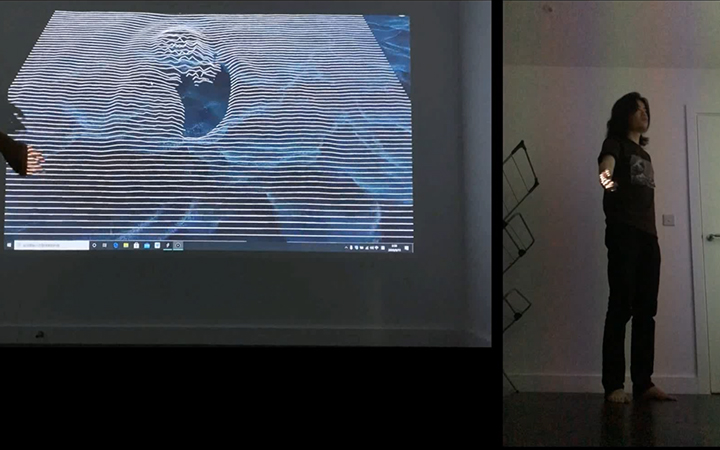
So far, my work has been completed. I made five sets of videos with C4D and put them behind processing as the background to create the "real environment" for my work. For the creation of the data environment, I chose the way of interacting between Kinect and processing. Recognize human hands through Kinect for interaction, and recognize processing images and produce the dynamic effects, All of which are also linked with the data of these five environments in reality.
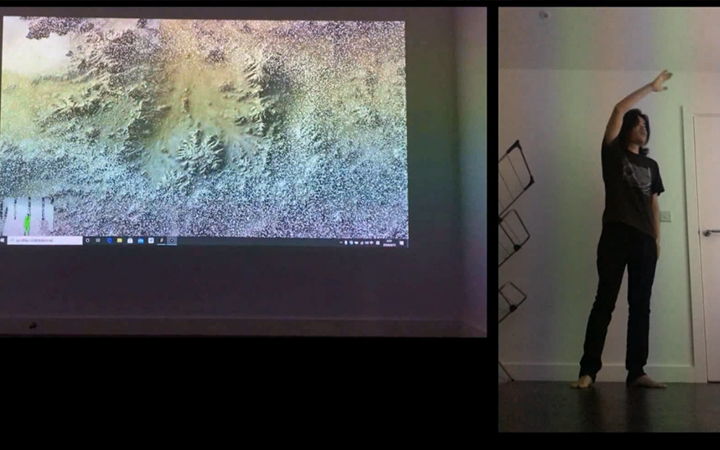
Ocean
By creating a series of particles, and then let these particles regularly form groups. Each group is a line or a wave. When we feel the trajectory of the human hand, the hand touches these groups, it applies force on the particles. Under the action of the force, the particle will move. After the movement, the line will be connected, and it will become a curve. Multiple lines will act at the same time ,it looks like waves.
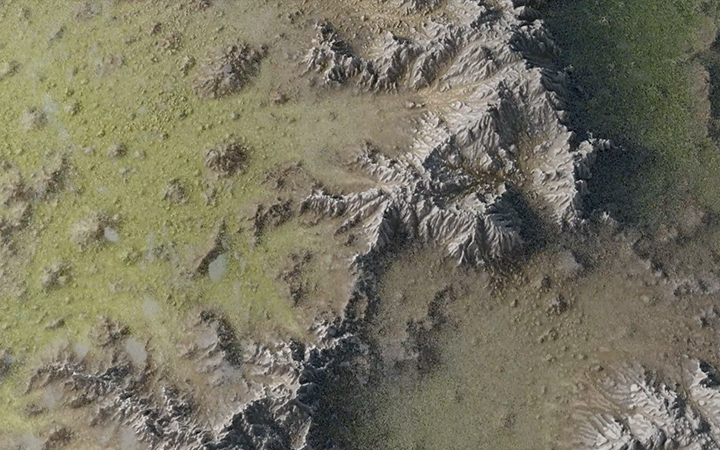
Ground
In the second part, I simulated the clouds. I simulated them by creating a large number of particles that move randomly. When Kinect recognizes the position of a human hand, it exerts a force on the particles near it. So when we wave, the particles seem to be pushed away.
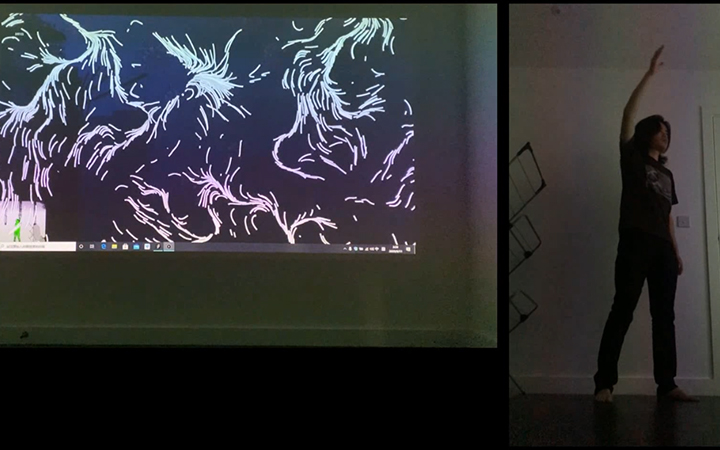
Spread
The third line follows the follow-up action. I also used the particle effect in this part. Actually several particles form the same group can form a curve which represents the trajectory of the particle. I gave them a random direction through the noise function, and then these particles will randomly move on the screen without external interference. When the movement of our hands is interfered, the direction and speed of these particles will be affected by the movement of our hands and will move towards the position of the human hand.
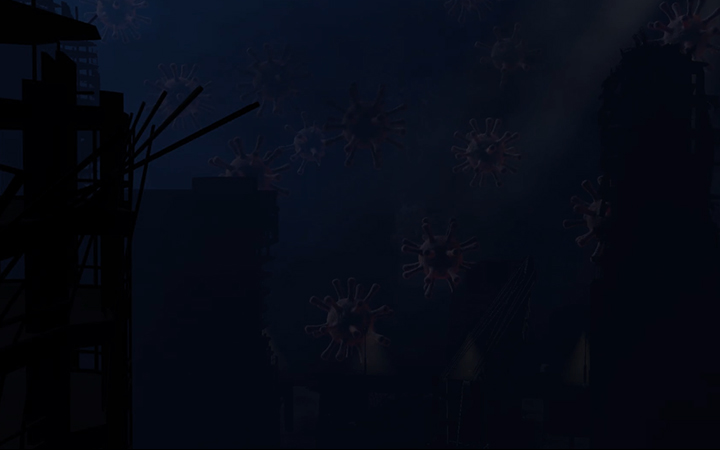
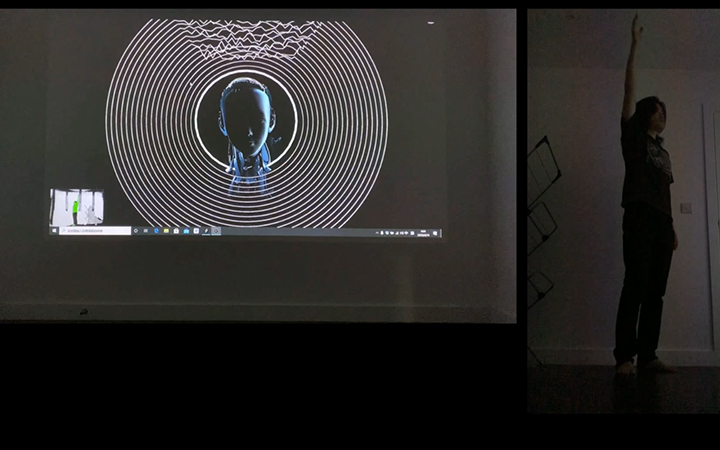
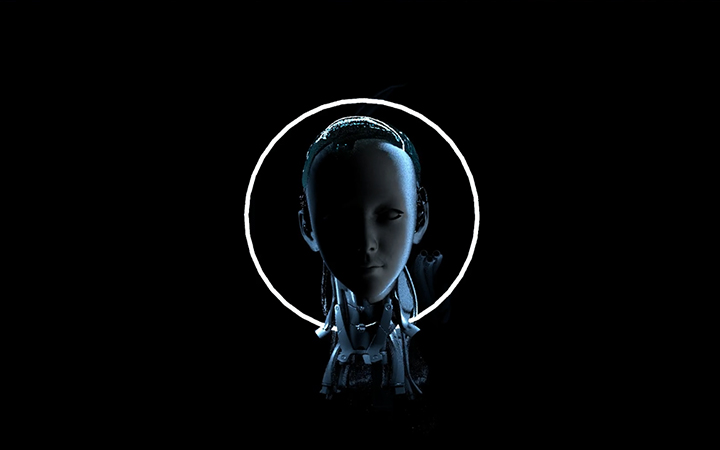
Machine
My inspiration for the fourth projects is the artificial intelligence’s meaning of "life". In terms of technology, I drew a series of circles in processing, and then changed the state of each circle by Kinect sensing the position of human hands. First, I get two points on this circle, which will be my starting point and ending point. Then I get an arc between the two points, which will change into the heart rate under the interference of human hands. When the distance between the position of the human hand and the center of all these concentric circles is less than the radius of a certain concentric circle, then the position of the starting point and the end point of the concentric circle will become the heart beating shape. When the hand keeps getting close or away from the concentric circles, the concentric circles will constantly become the heartbeat shape, and then return to their original state.
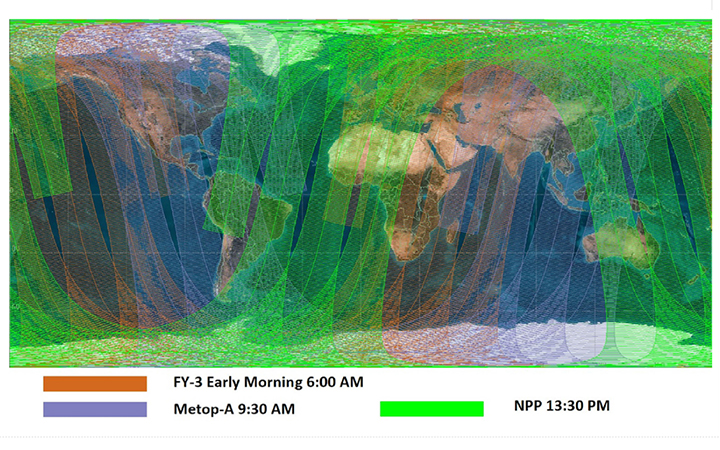
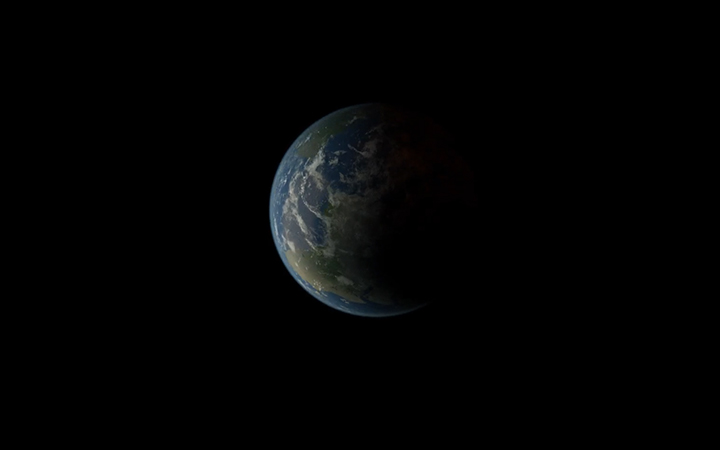
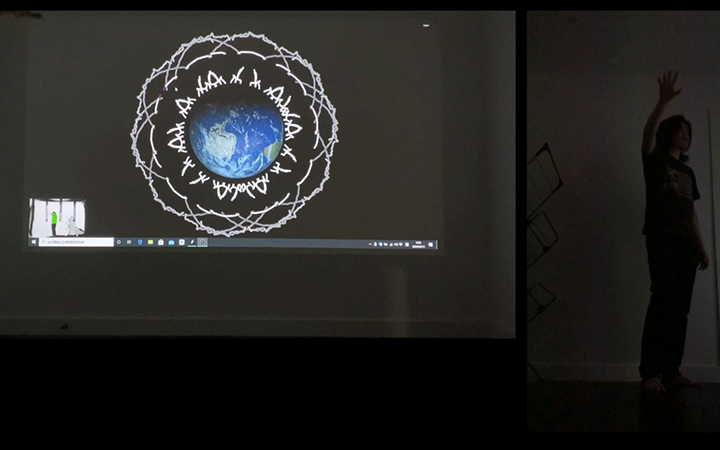
Universe
The last one is the kaleidoscope, inspired by the satellite's orbit around the earth. From the technical level, it is a kind of symmetrical drawing. First of all, I set a number of symmetries. When we move our hands, we will draw the trajectory of our hands, but not just one copy. We will draw multiple copies in the direction of 360 degrees according to the number of symmetries we just set. So a symmetrical pattern is formed. Then by changing the color of the lines, I get the final style of my design.
Future development and Self evaluation
The whole creation process is interesting and challenging. But there are still some deficiencies in my works. First of all, I only used processing in the application part of the code, and my original idea was to create a complete dance performance art. I designed different dance movements and wanted to express the visual effects I wanted. But because of the epidemic, I couldn't find enough venues and professional dancers. In the future, I want to learn more about Kinect code and try to find the relationship between different dance types and interactive art, which may be totally different from this work. But that's what I started with.
References
British Oceanographic Data Centre. 2020. Download UK Tide Gauge Network Data From BODC. [online] Available at:
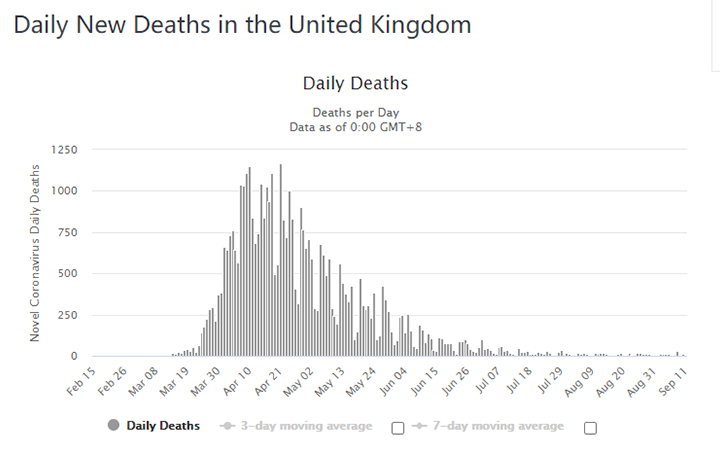
CMMID Repository. 2020. COVID-19 Transmission Model. [online] Available at:
Earthobservatory.nasa.gov. 2020. Catalog Of Earth Satellite Orbits. [online] Available at:
Sciencedirect.com. 2020. Environmental Data - An Overview | Sciencedirect Topics. [online] Available at:
Worldometers.info. 2020. United Kingdom Coronavirus: 429,277 Cases And 41,971 Deaths - Worldometer. [online] Available at: