


A First Visual Exploration of the Brain Activity
Working with Charlotte Maschke from the neuroscience department at McGill University, we combined forces to visualize her research.
produced by : Mirko Febbo
Introduction
Charlotte is doing a master's in neuroscience at McGill University in my home town Montreal. Her research revolves around consciousness. In the short term, she hopes to find a way to predict if a patent in a coma will ever wake up. If you fall in a coma there's little to no indication to see if you are conscient or not., except for brain activity. Which we can interpret with different tools. The ones we will look at are MRI and EEG.
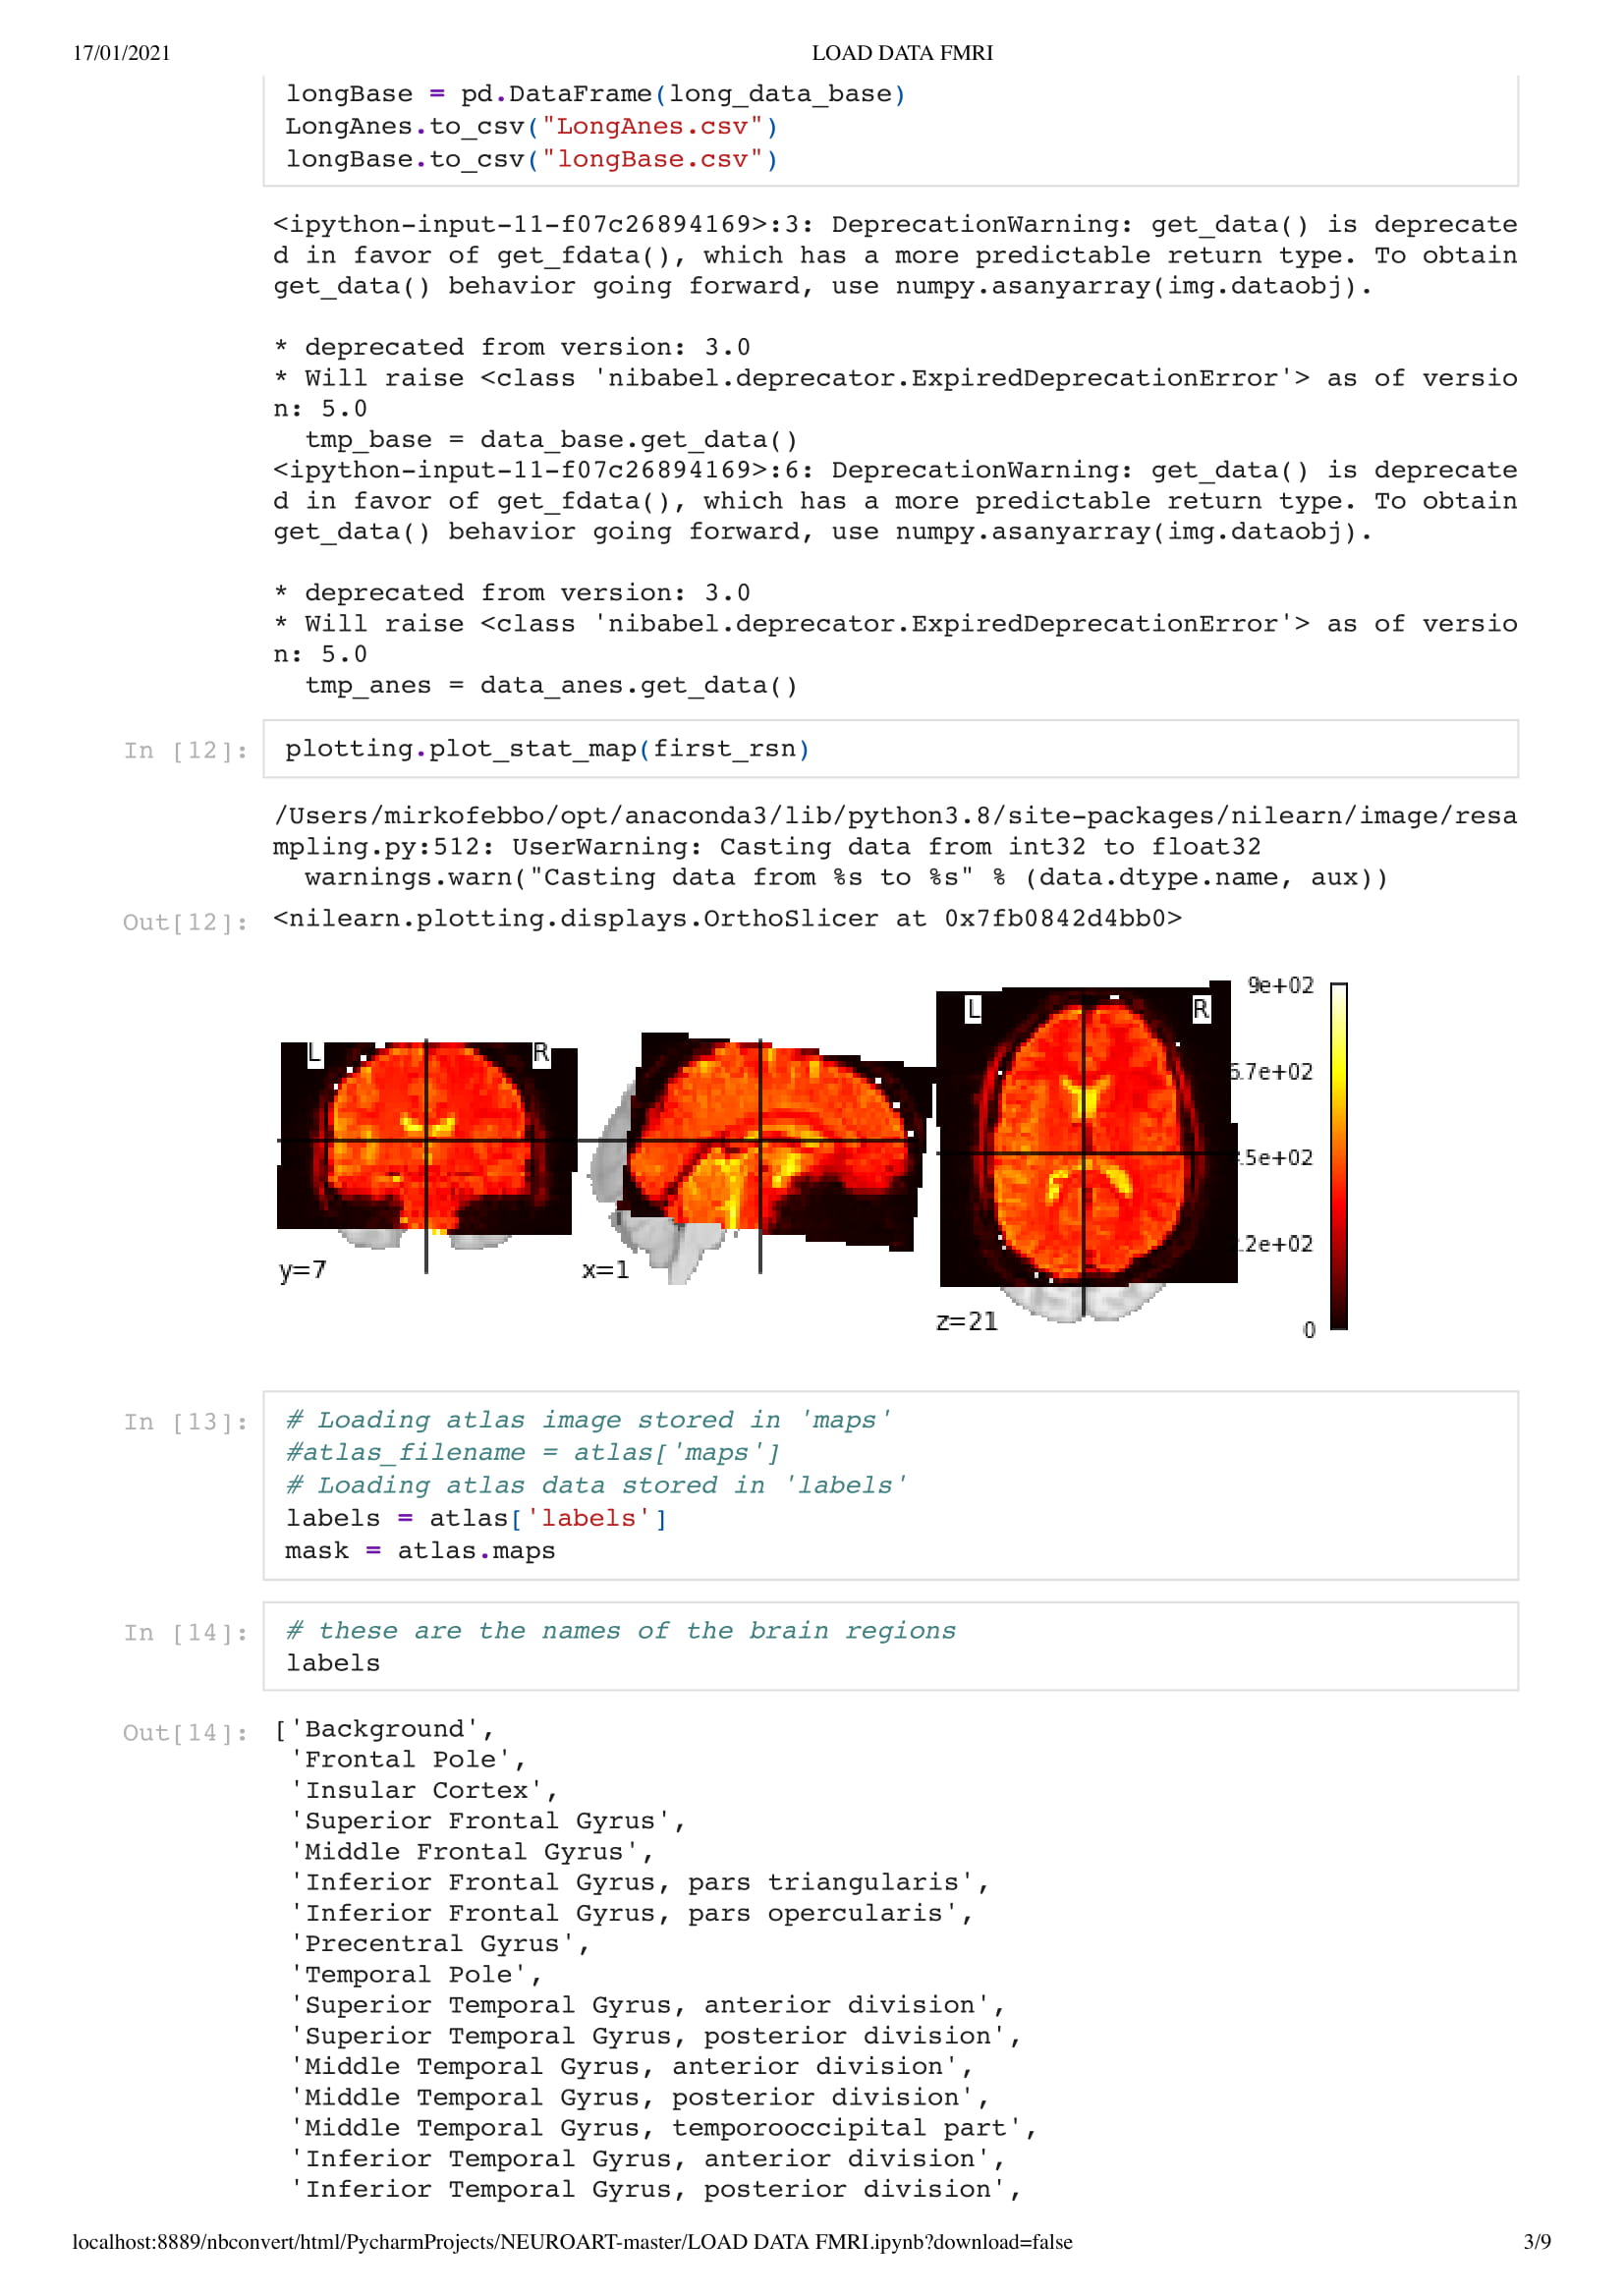
In an MRI scan, we create images of brain activity. highlights are made where there's oxygen flowing through an area. But how does this prove that the patient is still conscient? Well, if you can communicate with the patient then one could argue he is pretty aware. If the brain is still active and conscient, the person can still attempt to move. Thus sending oxygen to the area responsible for this particular movement. With technique this there's a code where the patient imagines swinging a tennis racket for yes and kicking a ball for no. Thus, while scanning the brain communication can be achieved. The downside with this technique is quite slow compared to actual brain activity.
Thus you have the EEG. This technic uses an electric signal to monitor brain activity. By connecting electrodes on the skull, one can have up to 1000 readings by second. This is less expensive and we can collect a tremendous amount of data. But, since it is extremely sensitive to ambient electricity it can pick up on housing electric current, thus generating noises. Of course with techniques like the Fourier transform you can isolate the brain activity. But it still does not look at the area in the middle of the brain.
To better understand coma, one can put the brain in an artificial one with the help of anesthesia:
"Task-independent assessments of spontaneous brain activity and further understanding
of neural mechanisms supporting consciousness are needed to assess an unresponsive patient’s
level of consciousness and potential to recover with better certainty. In this project, we are
combining machine-learning techniques with a high-density electroencephalogram (EEG) and
graph-theory analysis to identify predictive features for the recovery of consciousness in
unresponsive patients. The aim of this project is to characterize (1) the spatial-temporal
the architecture of functional connectivity, (2) the brains’ response to perturbation, such as
propofol-induced anesthesia and (3) the predictive and diagnostic value of spontaneous brain
activity for patients in a DOC."
Charlotte Maschke.
This is where I come in.
This year, Charlotte is looking at the brain in two states, base and during anesthesia of patients in a coma and healthy ones. And my goal would be to derive an informative visualization of Charlotte work's.
Concept and background research
For this project, since we did not yet have access to her data, due to university research policy, we worked on open data from an MRI scan that looked at the patient brain before, during, and after anesthesia. With this material, I got inspired by Kirell Benzi and Refik Anadol two very talented data artists, to start exploring data as motion. To do so I relied on the classic boid algorithm, using the brain activity as speed, in this project, I attempt to visualize brain areas as a flock while comparing the baseline and anesthesia brain data.
Keeping the fact that I have to maintain up to 3 minutes of human attention, instead of simply presenting the end result as a long video I project the evolution of the exploration, from the brain areas in 2D to the relation between the raw data and the mean (areas).
Technical
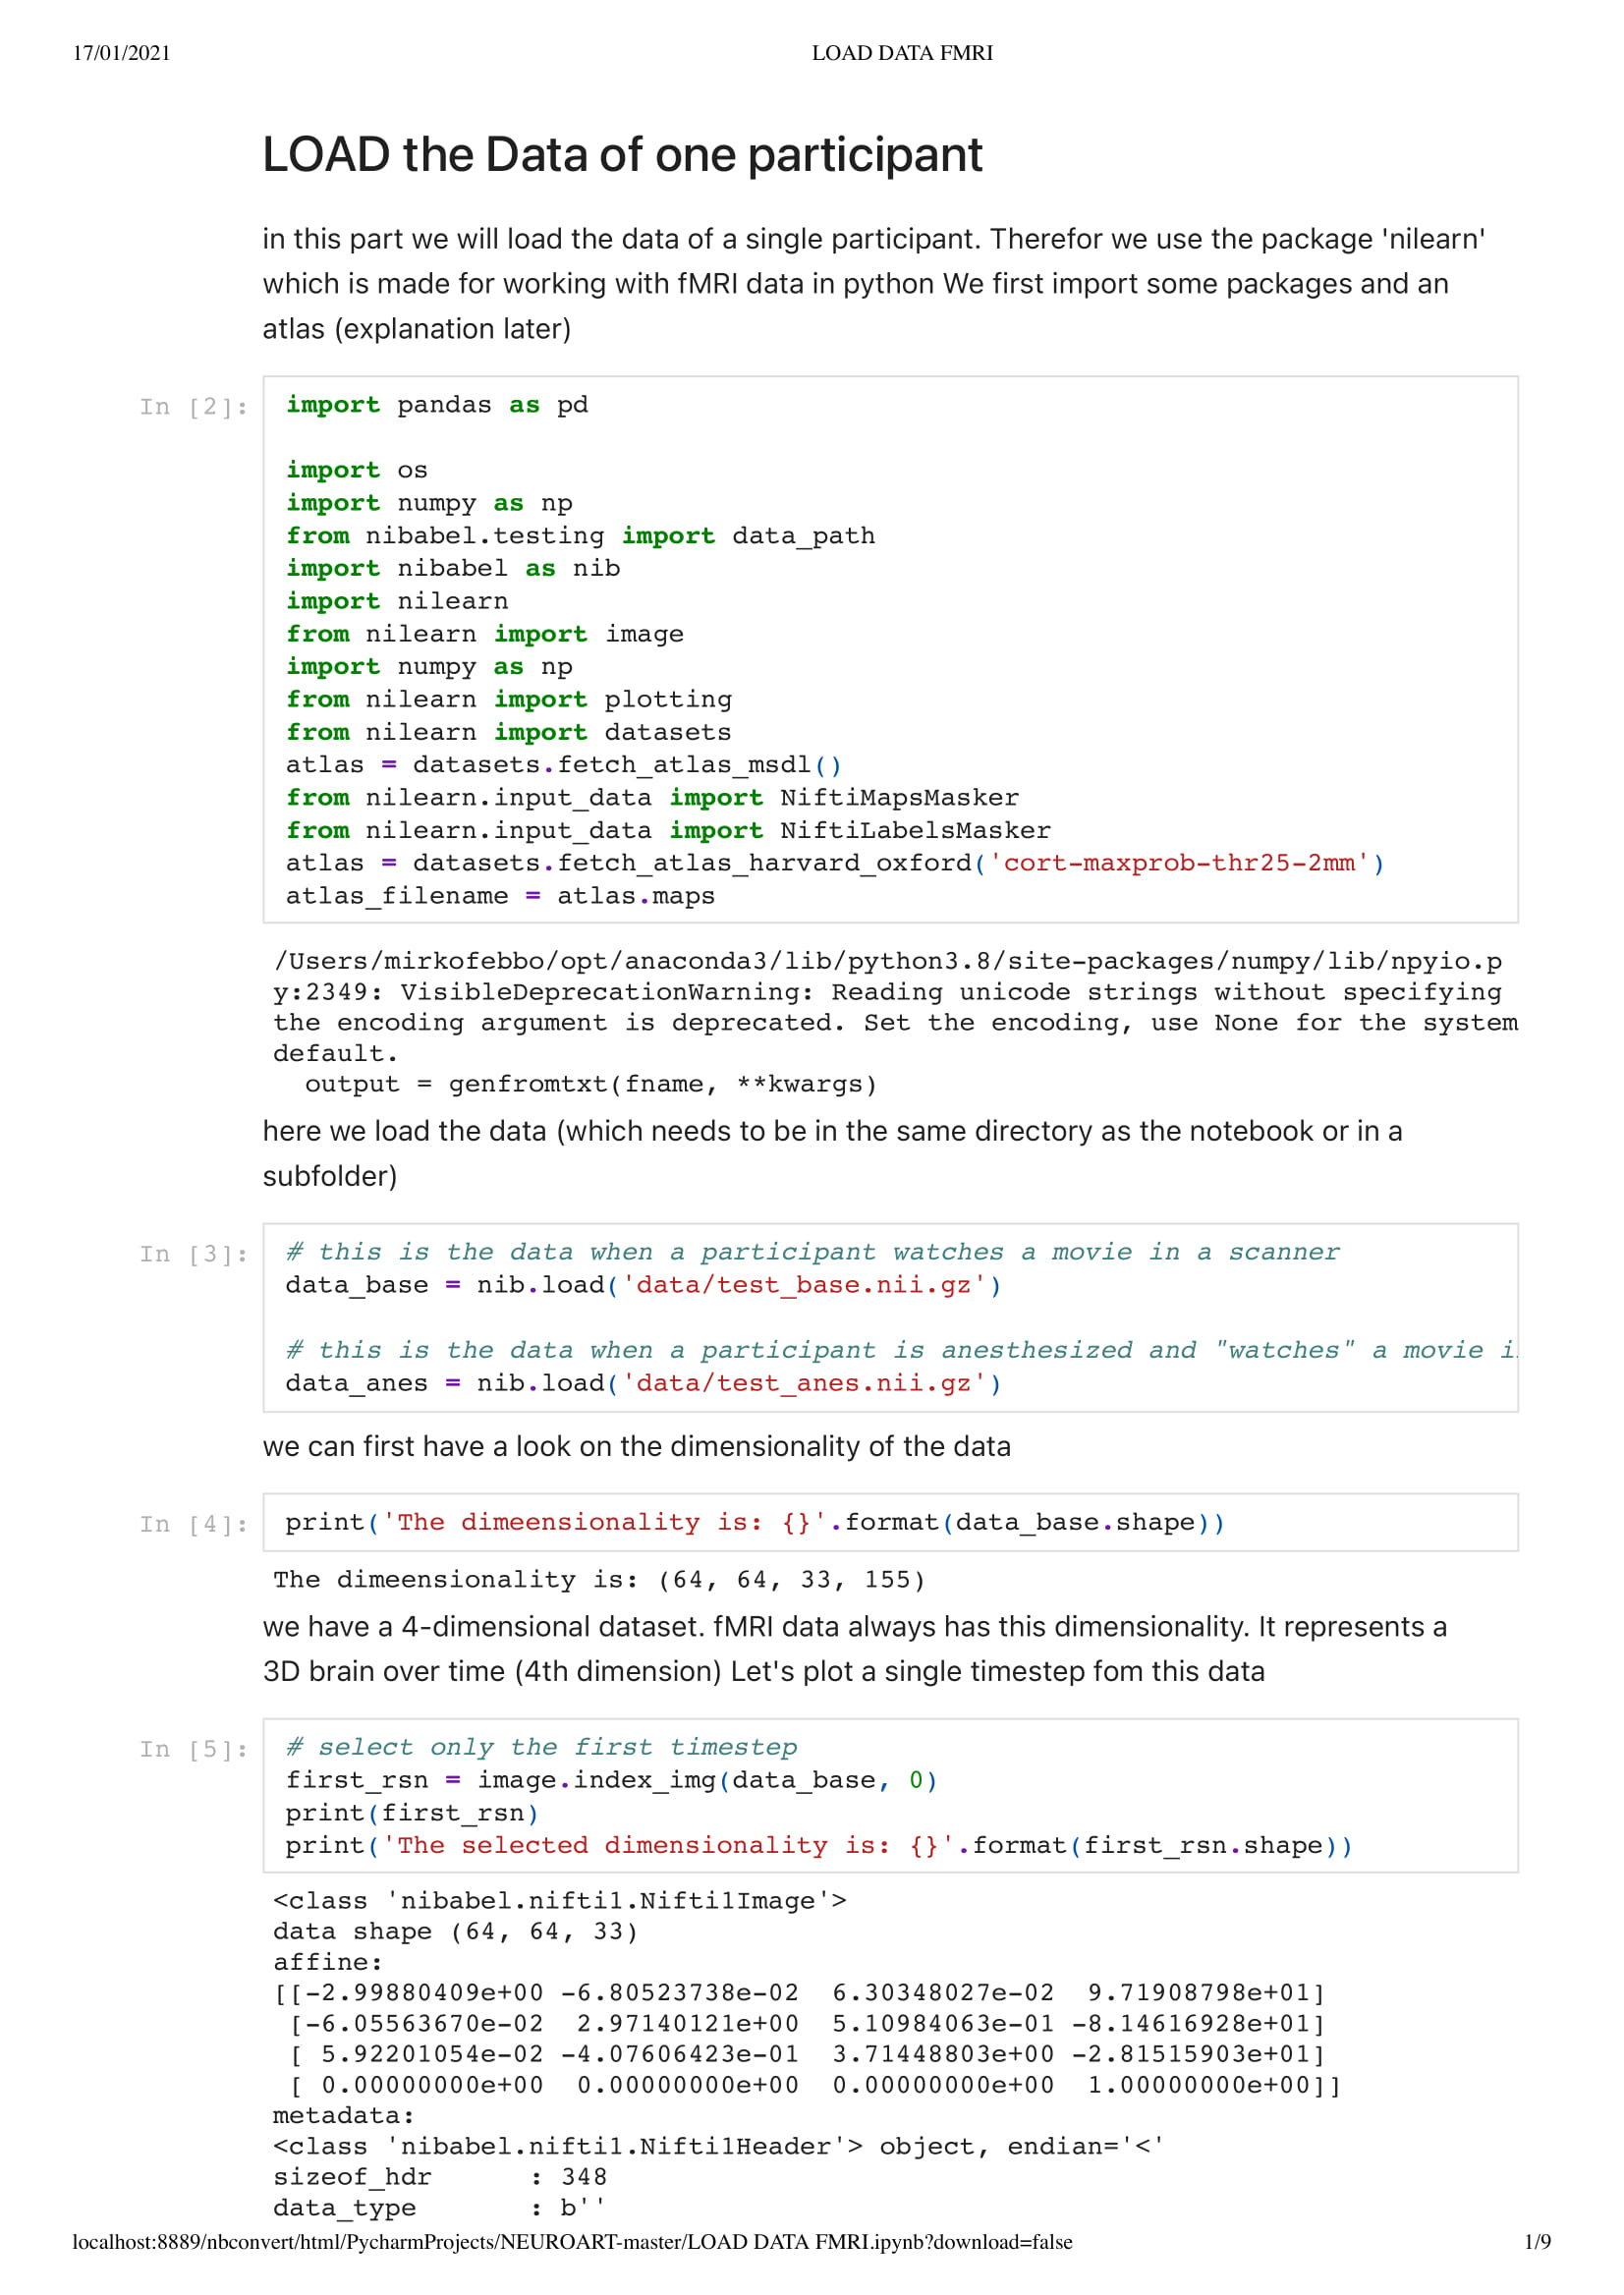
First of all, a really interesting thing to know is that most of the data are saved as 4D or voxels... In 2D grid... And I might have some knowledge in data science, I am unsure where to start with this kind of data. Thus, Charlotte prepared me an easy environment in the form of a python code, so I could work out what I needed even with my small understanding of python. She also sends me some intro tutorials in the wonders of neuroscience and python.
Neuro Boid 2D (Technical.2)
To kick things off, I experimented with the work of the wonderful, patient, funny, Daniel Shiffman and his Boids tutorial in Processing. With this first work, I set the basic rules that I will follow during this project.
Orange for the base data set
Blue for the Anesthesia data set
data is the max speed of the boid.
Every second they change speed up to 155.
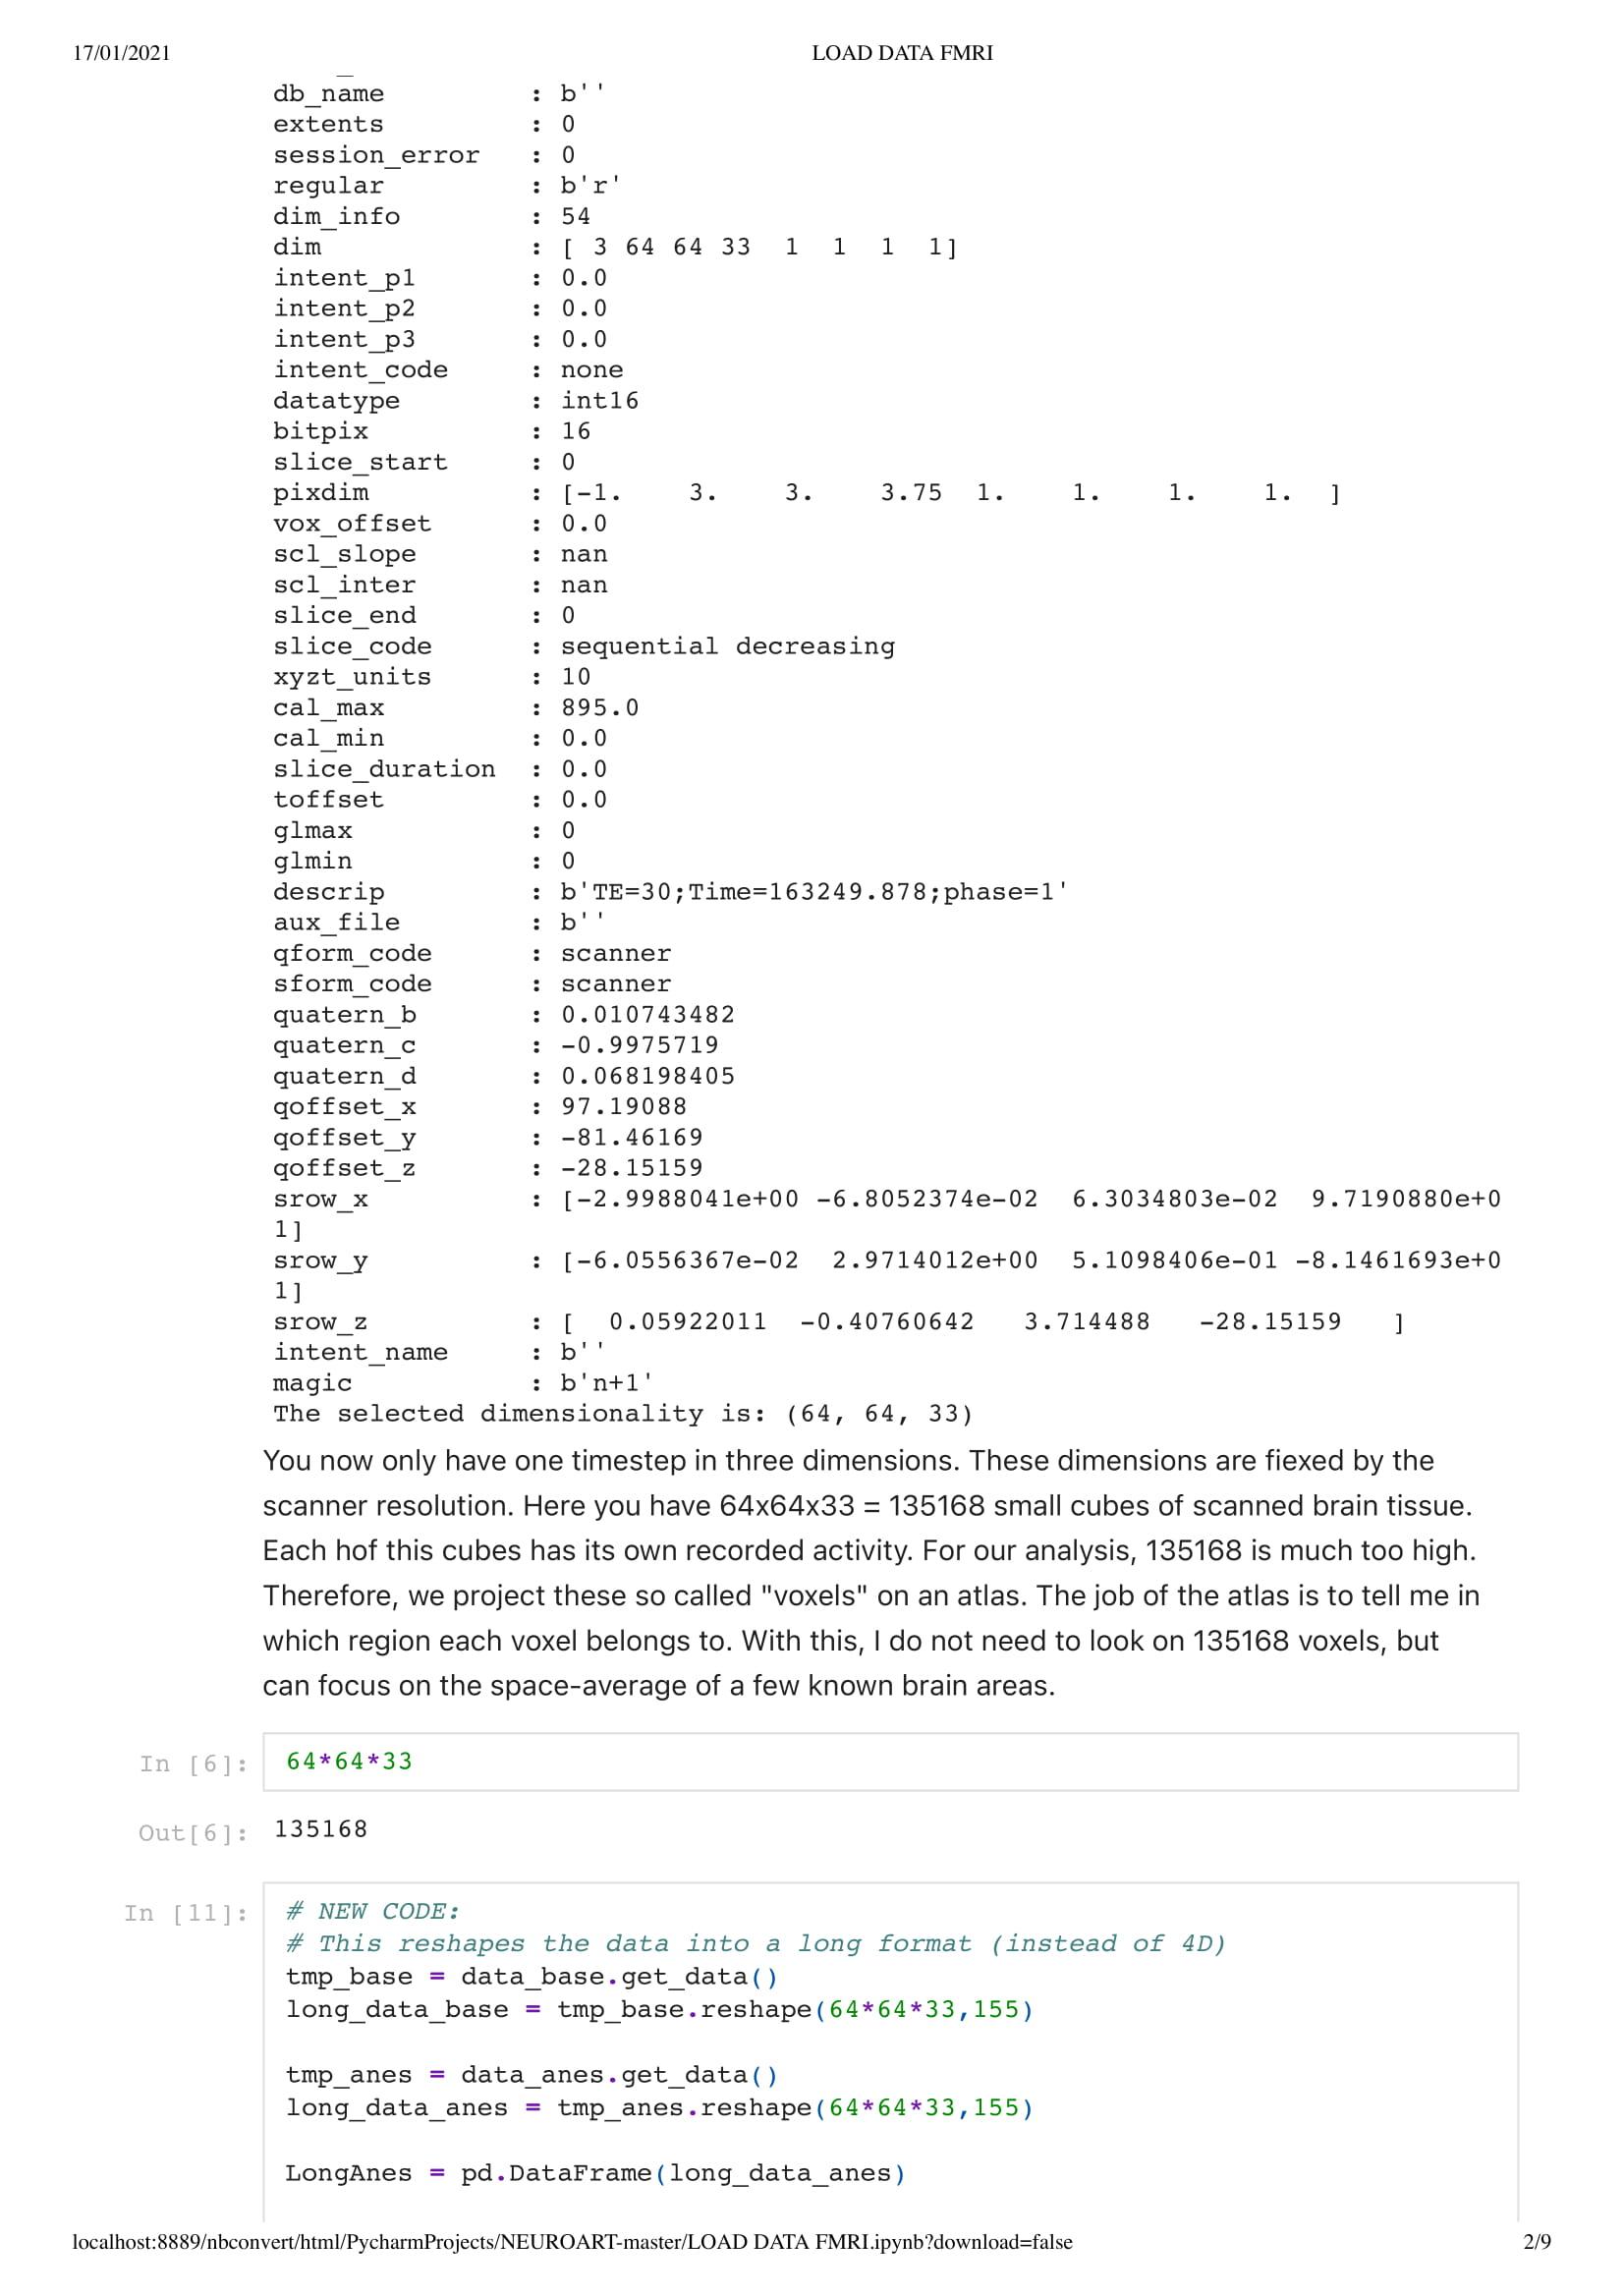
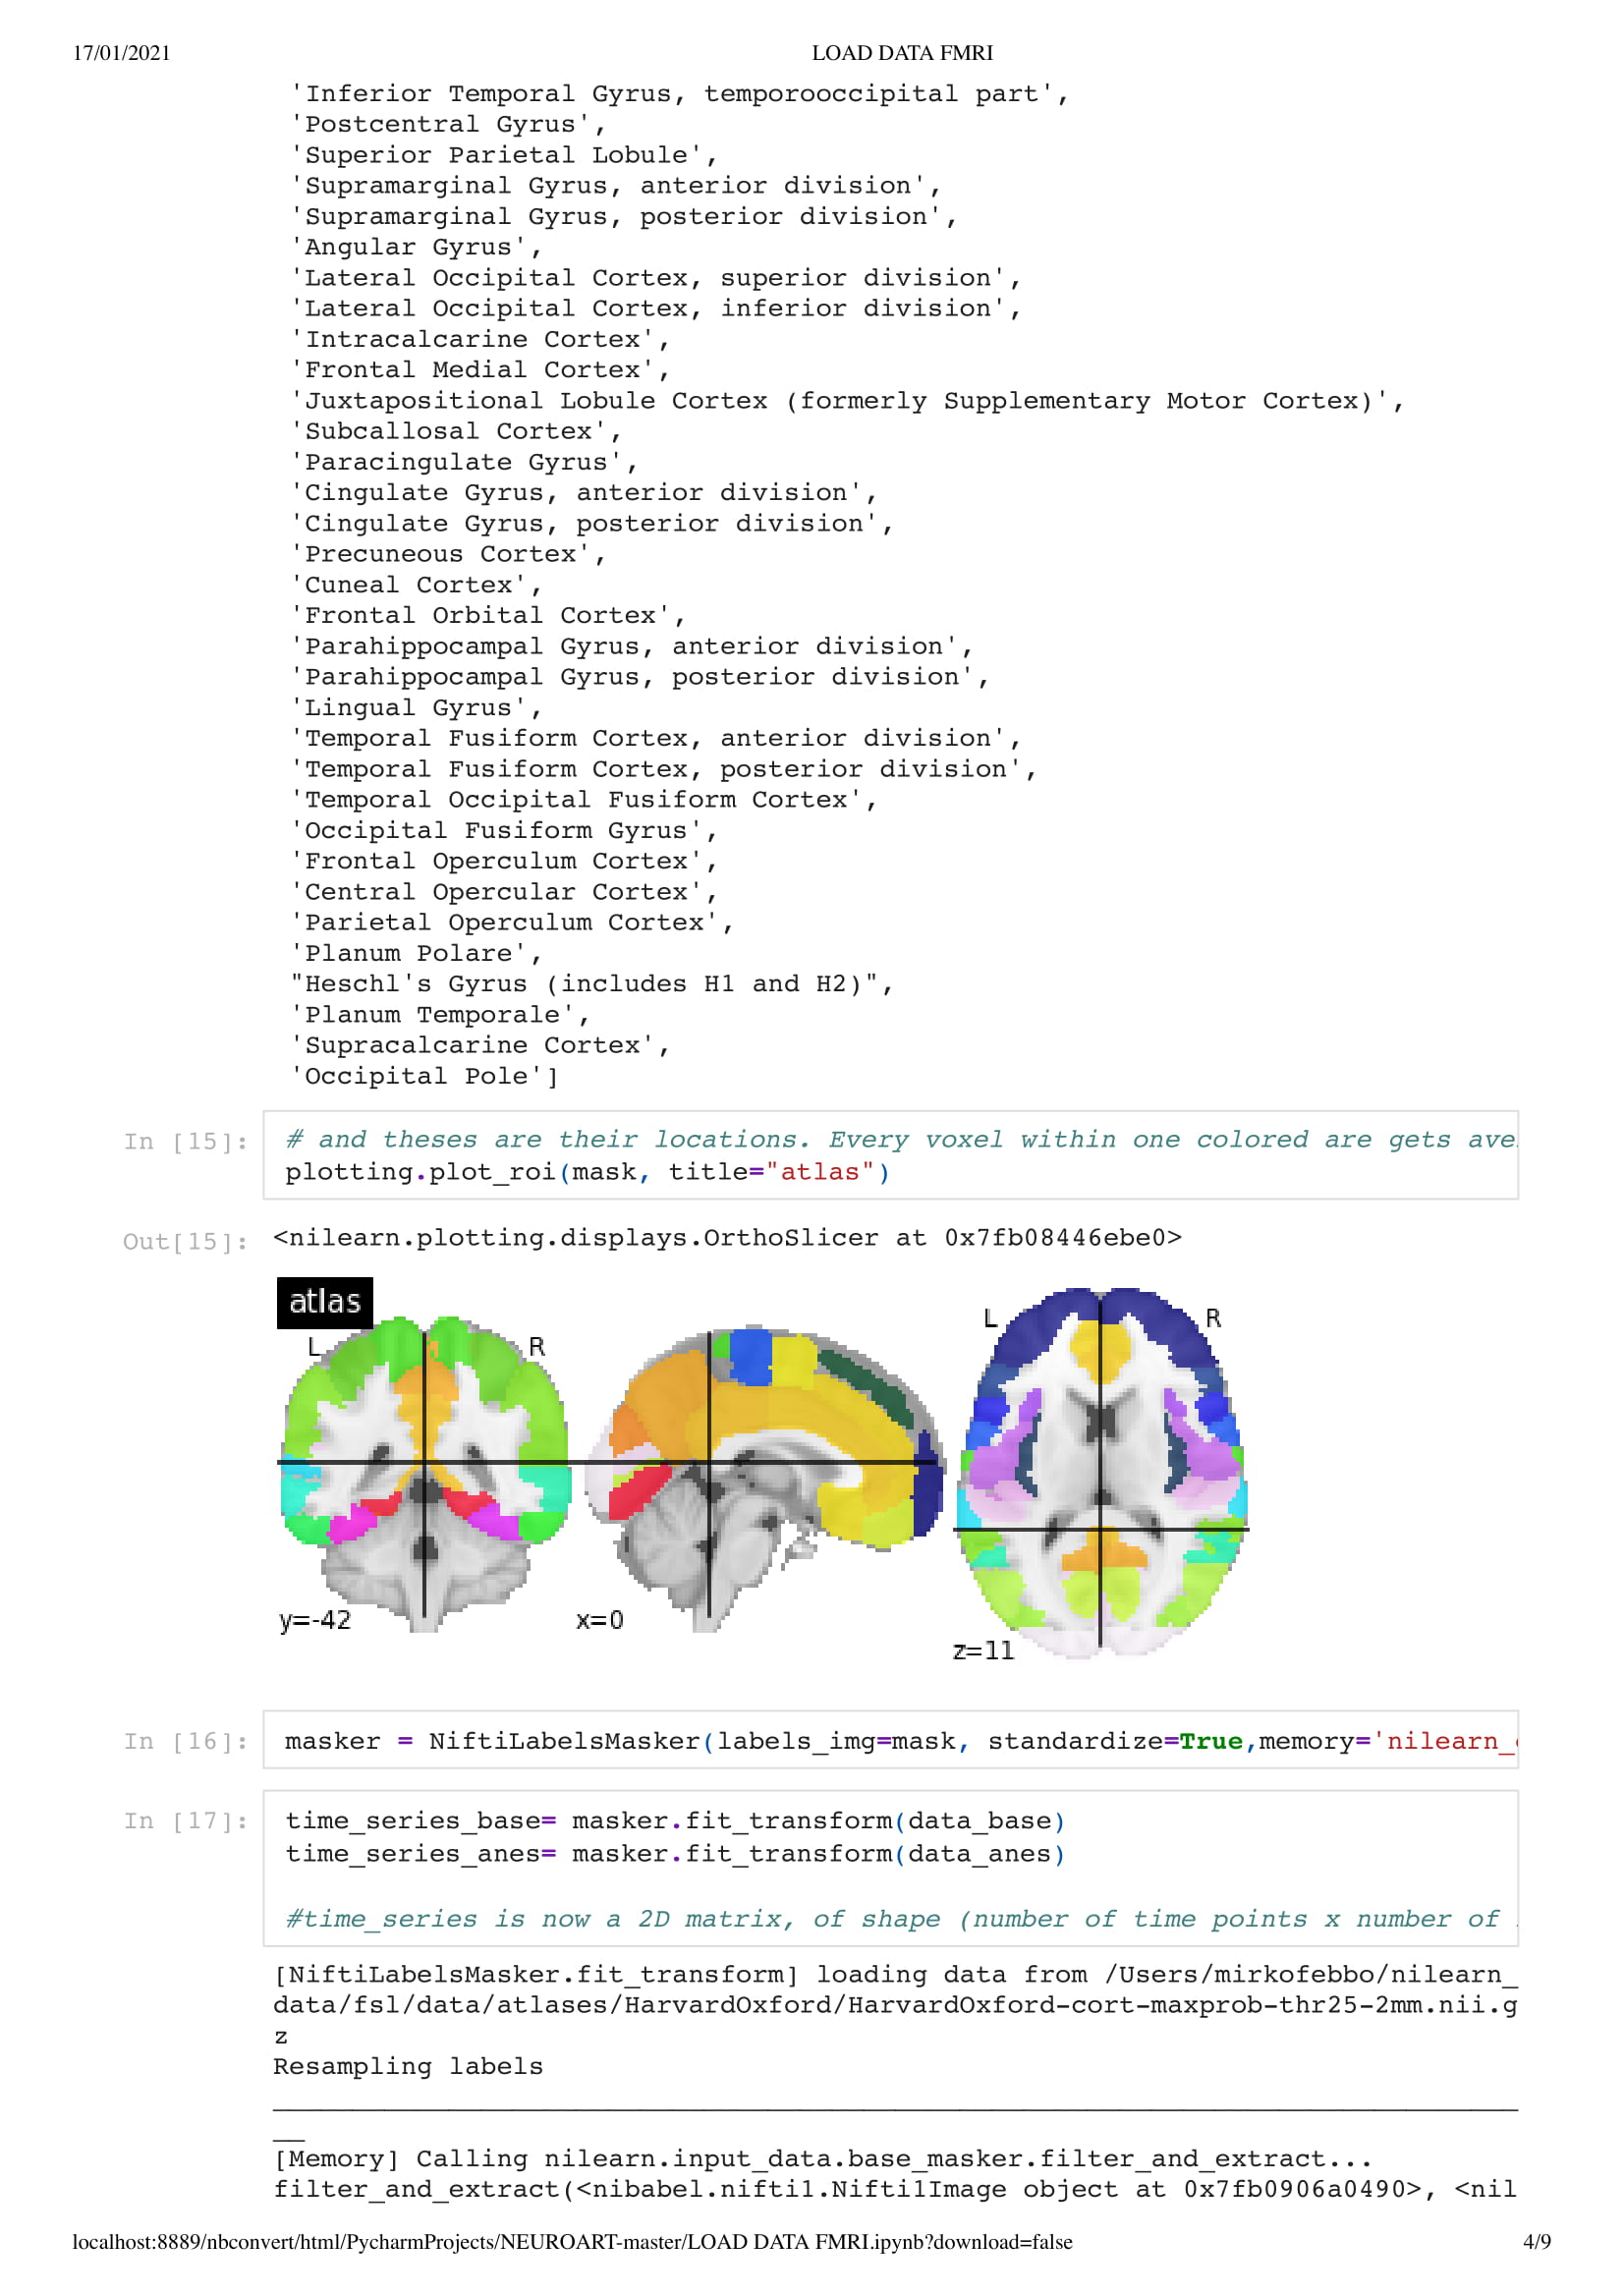
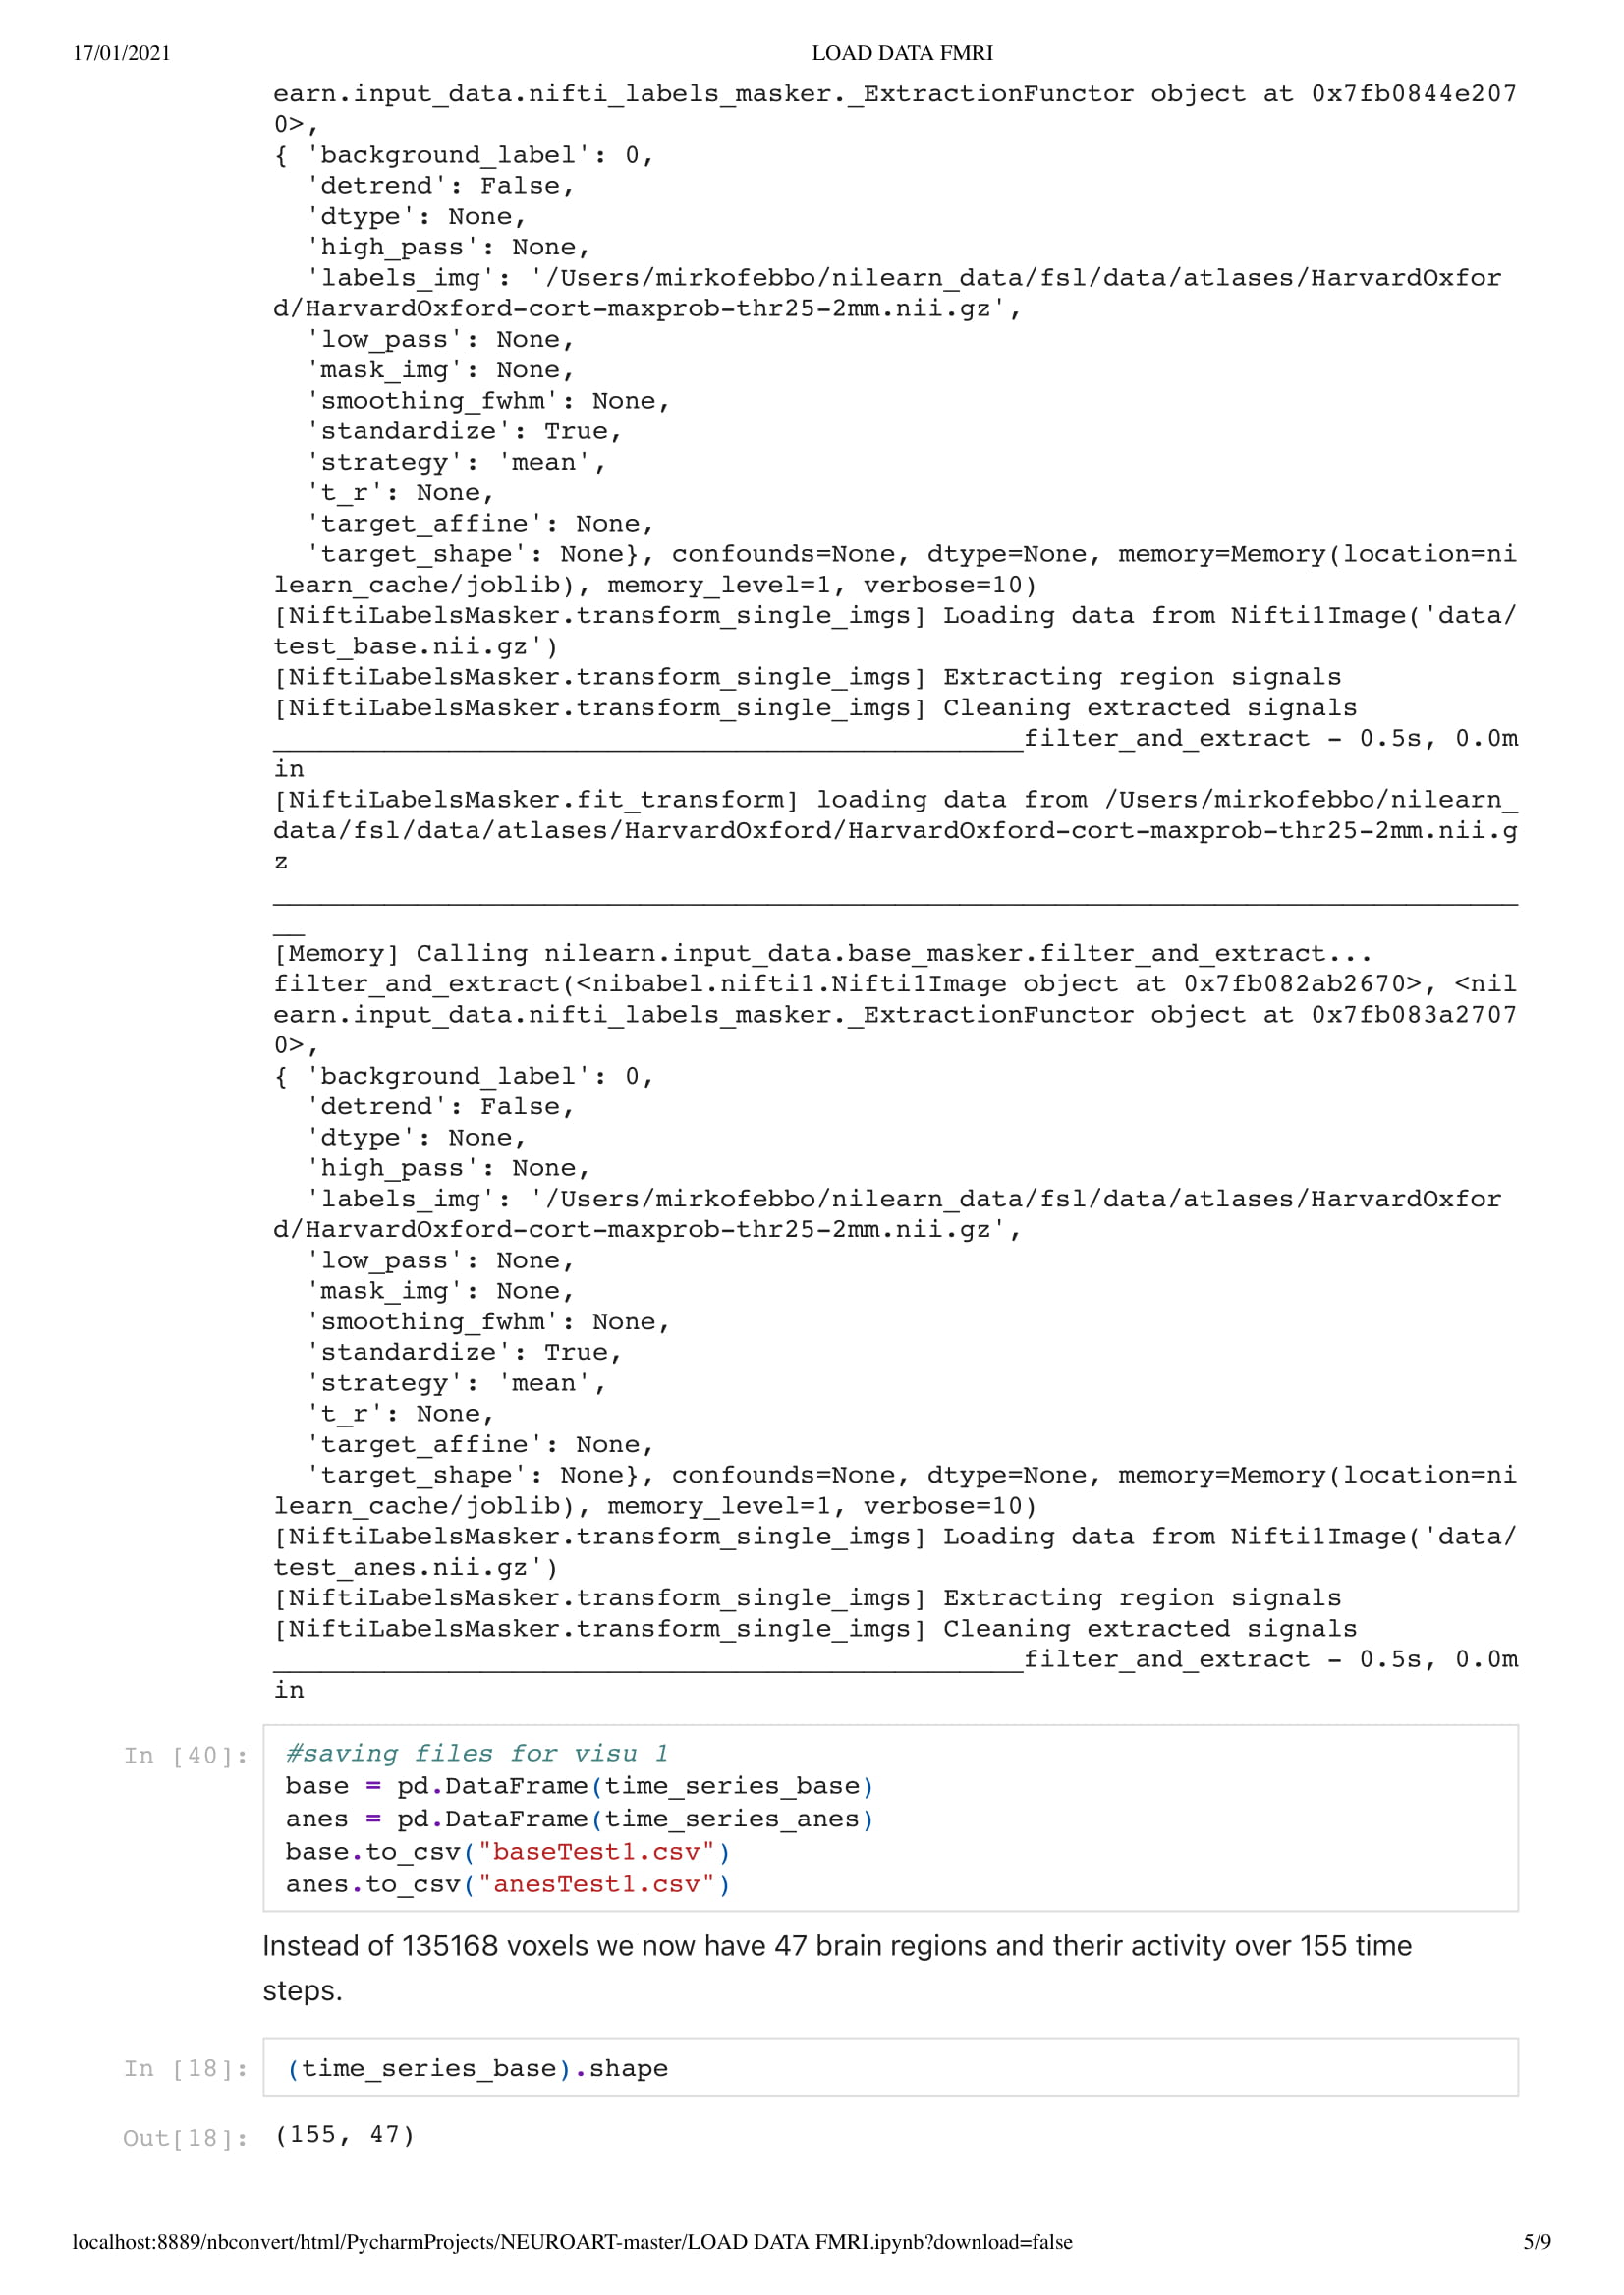
In this particular work, we are looking at the means of the area. Considering the raw data set is around 130,000,000 in size. Using the mean of the area is a good solution to understand the overall activity of the brain.
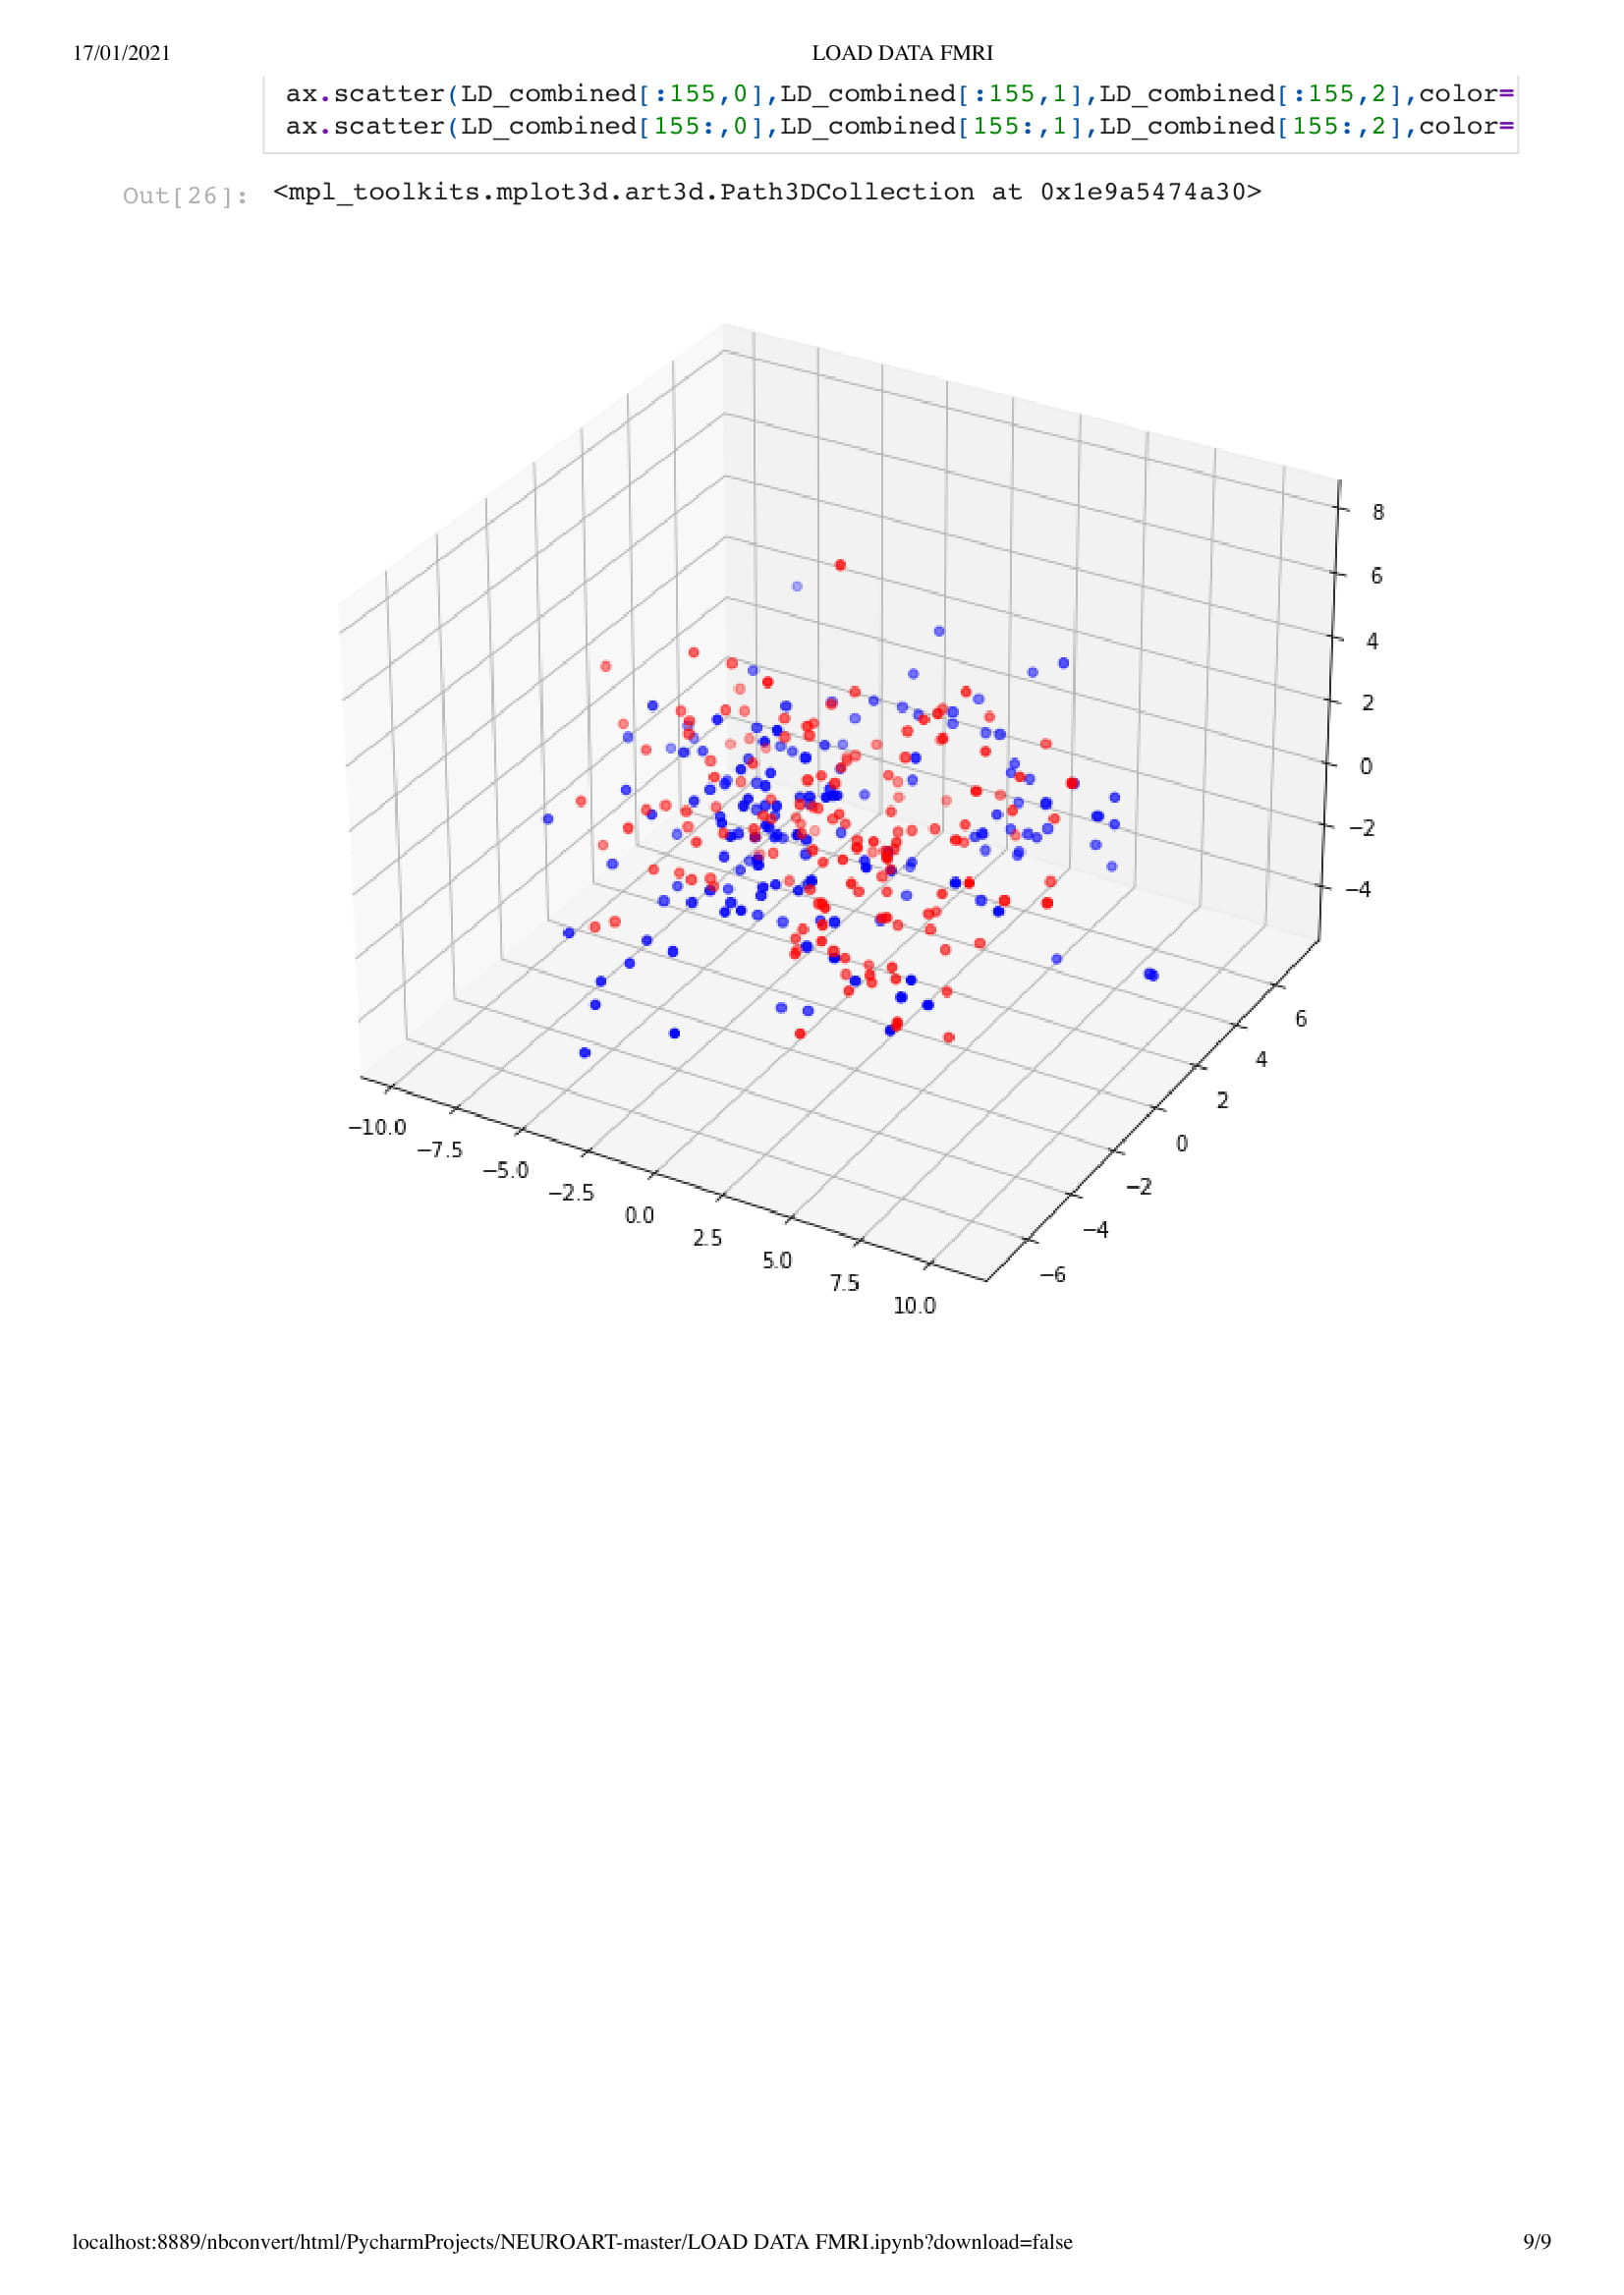
Neuro Boid 3D (Technical.3)
Next, we add a dimension to the previous sketch. Which brings an interesting concept. Since we don't want the dots leaving the space, I had to place them in a box. This brings an interesting metaphor considering we are looking at the brain activity of people in a coma. People that have very limited contact with the outside world, outside of their brain that is.
Neuro Boid 3D Raw Data (Technical.4)
Since we master the 3D environment and that the code is set for any data set, we can now start to think about increasing the number of agents. This is an extremely sensitive thing since we have up to 130,000,000 float points to visualize and my computer has it's limit, Charlotte mentioned that she would often use the Canadien supercomputer to be able to do a large sum of computation like analyzing a 10 second cut of EEG data. Thus, until I have my supercomputer under my desk I will have to respect the limits of my computer.
Which is two data set of 500 x 155
Neuro Boid 3D Raw VS Area (Technical.5)
Now things are starting to get interesting. Indeed, flowing the code of Abdullah Al Attar and his interpretation of Dan Boid code in Openframeworks, I could, not only translate the code from java to C++ but also, (after a couple of days of trial and error), understand how to have one vector of object following another vector of object. Thus creating 4 vectors of object. 2 for the areas and 2 for the raw data.
Plus the raw Boids are attracted by the area's one, but not the inverse. It's not perfect.. yet.
Future development
Now that I have a better understanding of the scale and how to implement brain activity as speed, as well as vector object connectivity I have a nice starting set of tools to create meaningful visualization. Which is a good time since I just have been given access to Charlotte's data set. We will now be working on the same data set and she will be updating me on here process and progress. Thus, fueling my creative drive. For the future of the Boids, we will be including the phase lag index to estimate connectivity in EEG thus having the location between flock meaningful. I also want to work more on the raw data following the area data. I would like to have a selection of the most active input from a selected area and have them flowing their respective area instead of the first set following it. To solve a part of the data size I could explore mesh, if, as I understand it, could be a bit faster as it draws all of them at the same time instead of running one at a time? And, of course, work on a less boring visual...
A bit like this one:
Self-evaluation
There's a couple of things to improve for sure, first, it could look better as a projection mapping. I don't think I took full advantage of the ofxPiMapper toolbox. And again when it comes to the visual it lay a bit flat and needs some upgrade. As for the code itself, it is mainly missing comments and probably more exploration away from the inspiration code. What is great tho was that I had to regularly jump from python to R to Processing and then to OpenFrameWorks to work the data, test things, and explore behavior. And I think that conceptually it is a very engaging project that laid the foundation for further improvement and research.
References
Flocking Simulation by Abdullah-Alattar :
https://github.com/Abdullah-AlAttar/Flocking-Simulation
Flocking Simulation by Daniel Shiffman:
https://www.youtube.com/watch?v=mhjuuHl6qHM&ab_channel=TheCodingTrain
Julie Onton (2020). Imagined Emotion Study. OpenNeuro. [Dataset] doi: 10.18112/openneuro.ds003004.v1.0.0
https://openneuro.org/datasets/ds003004/versions/1.0.0