


The Future of Our Seas
Kerrie O'Leary
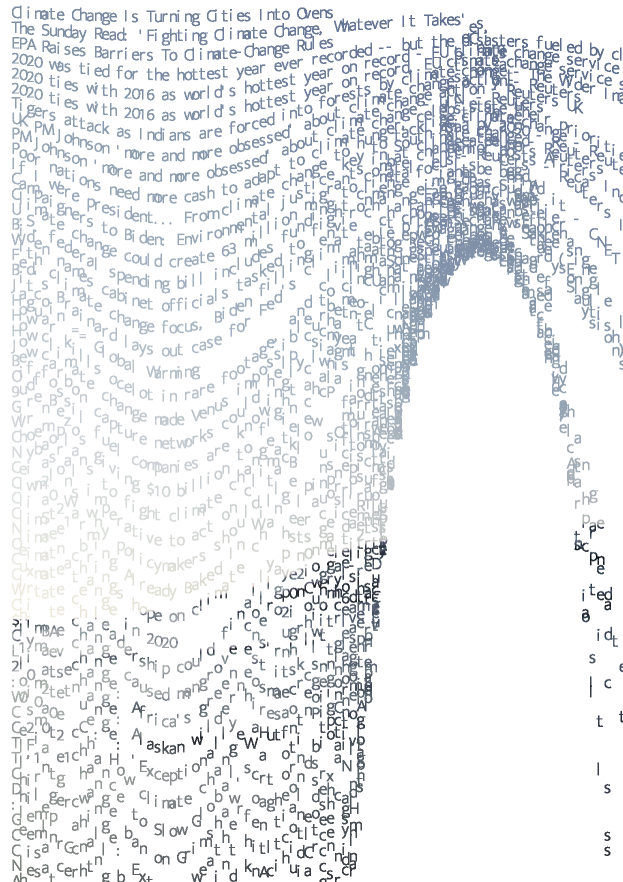
screen shot of final page of 'The Future of our Seas Book
This project aims to create awareness about climate change and the increase in sea levels around the world.
My motivation for this piece is a combination of my passion for the sea and my concern for it’s future. I wanted to work on something that would develop my Processing skills while creating awareness about the impact of global-warming on our oceans.
Concept
My motivation for this piece is a combination of my passion for the sea and my concern for it’s future. I wanted to work on something that would develop my Processing skills while creating awareness about the impact of global-warming on our oceans.
One of my favourite lectures during the first semester was our lecture on Data, Translation and Visualisation. I am keen to produce artwork with information at it’s core. Often people understand visuals better than data-sets, large-numbers or pie-charts.
Data visualisation artists, Fernanda Viégas and Martin Wattenberg, use live wind maps using data from the American National Digital Forecast Database. Using dark colours his work is strong but delicate with constant movement. Artists Pekka Niittyvirta and Timo Aho created an incredible installation in Scotland using sensors to detect high tide. The sensors activate light lines of the projected high tide levels if climate change continues at is speed today. This way of communicating weather data and the impact of global warming is very effective, it’s far easier for people to grasp the severity of the situation seeing it applied to real life than reading about it in percentages and millimetres.
Keen to follow this simple but effective approach, I decided that by combining headlines from news articles people read on a daily basis and estimated sea level figures would be a strong foundation for my project. Juxtaposing the headlines from the past and the estimated figures of the future I chose to create a book that would represent the predicted rise in sea levels from 2020 to 2100.
Technical
I knew I would need to use an API request and also a data table to pull the predictions from. The best way to do this was to use object oriented programming, and create two separate sub-classes to tackle the tasks individually.
In the API Class, I used an API request to collect headlines from a news API website. I chose to search for headlines that included terms such as ‘sea-levels’, ‘global warming’ and ‘climate change’ that occur frequently in the news to make sure I would get enough data. The request is stored into an Array List with a maximum 80 headlines collected, one for each year of the predicted values, with duplicates removed. Initially I had planned to use the image associated with each headline to be the background image for each page but as I progressed with this plan I found that a lot of the url-images were logos for the specific source the article was in, Yahoo, etc.
For the Sea Level Rising class, I downloaded the predicting rise in global mean sea levels collected by the Intergovernmental Panel on Climate Change, (Chapter 4) and used the ‘moderate’ predicted figures for this project. I loaded this data into an CSV file and saved it in the sketch folder. I wanted these predictions to show the accumulative effect so I added each value incrementally and stored them in a new array. The index of the headline will determine what year/index to pull the prediction from in the array, e.g headline 1 will use prediction for 2020 and headline 80 will use the prediction for 2100. The headlines are passed through by the parent class and split into a character array. Using the predictions array, each character is printed along a waved line determined by the estimated rise and the sine function.
The parent class sets up the PDF and loads the image I chose for the background. A simple photograph of a wave, taken by my brother. I chose a simple font to keep it minimal. The search query terms are passed in to the API class in setup so the API is only loaded once. The final array determined by the API Class is then passed to the Sea Level Rising class. Using nested for-loops a new page is created for each new headline, printed under the previous ones. As the number of headlines increase, more and more of the image is revealed. The idea of having just one headline added per page is to show the slow gradual change that happens every year but to see as the book progresses, the drastic result of the accumulative change.
Challenges
We had only touched on object oriented programming and API request so this project was certainly challenging. I came across a number of obstacles, so splitting the problems into small problems and testing each function on smaller data tables and string arrays/lists really helped. The first was trying to understand how to successfully make API requests, especially when I was planning to use the image urls for the background. The documentation on the News API page was invaluable to the success of this problem. Because the results can be different each time the program is run it made it difficult to assess if duplicates had been removed, especially as the size of the requests increased.
There are multiple nested for-loops used throughout this program, (removing duplicates, creating sublists for the incrementing text per page) that become confusing to troubleshoot. Using println was crucial when debugging and solving issues with pages printing incorrectly.
I was determined to stick with my original concept and I am happy with the final output. The supporting video is a screen recording of my process, from loading the data to understanding the API responses.
The simplicity of each page aims to translate how simple the solution can be. Everyone needs to play their part and make small changes. The hope is by the final pages the text is so disformed and illegible, that the viewer is reminded how unrecognisable our world will look if climate change continues at today’s rate.
This book is an expressive work highlighting the potential future of our seas.
video highlighting the complex parts of my project
References
[1] Pekka Niittyvirta and Timo Aho, Lines (57° 59´N, 7° 16´W)
https://hyperallergic.com/489076/artists-illuminate-the-catastrophic-future-of-rising-sea-levels/
[2] Fernanda Viégas and Martin Wattenberg
http://hint.fm/projects/wind/
[3] Intergovernmental Panel on Climate Change
https://www.ipcc.ch/srocc/chapter/chapter-4-sea-level-rise-and-implications-for-low-lying-islands-coasts-and-communities/
[4] News API
https://newsapi.org/docs/endpoints/everything
[5] Daniel Shiffman – Exporting PDF examples, image mask() examples, API request example
[6] Photo credit, Ryan O’Leary