


The Sonic Pharmacy
The sonic pharmacy aims to transfer the patterns of people’s irises into another sensory perception which invite the participants to a meditative level and hence bring the therapeutic effects to them through an abstraction in both visual and auditory manner.
produced by: Sarah Song Xiaran
Introduction
The biometric data analysis is seen as an interesting research field. There have been quite a number of studies and experiments on biological data sonification although it is still a rather young discipline. The Sonic Pharmacy invites the participants to enter a meditative journey after their iris has been captured. A digital ophthalmologist (me and my computer) is going to give an eye test and then a sonic prescription to the patient (every participant), I consider that to be a performance Bioart piece. The unique patterns and structures of their irises will be transferred into another meaningful sensory perception through abstraction in both auditory displays and visual space I created. I seek to transfer the irises with image sonification techniques and to visualize the patterns of irises with real-time visualization techniques. Considering both iridology and sound healing as the alternative therapy, I create a new sonification system by using the integrated therapeutic intervals and link them with the 7 zones of iris. I call these notes “Sonic Vitamins” since everyone has different vitamin requirements and these special vitamins are sonic nutrients your body needs in small amounts to work properly and stay healthy. In this case, through the interaction with this performance-based media artwork, the audience can be both the “patient” and “healer”.
Concept and background research
It is a data sonification and visualisation piece as further development for my previous project “COSMOS”(2018). This time I added visuals to my piece and developed a new sonification system in the past year.
Iridology (map of our eyes)
Iridology is a study that focuses on the structural patterns and colours in the iris with its potential to reveal disharmonies in the body. Although the first documentation of iridology is said to be found in the year 1670, the true birth of iridology began with Ignatzvon Peczely, MD (1826-1911), a Hungarian physician (Jensen, 1982). As a matter of fact, the iris is connected to every organ and tissue of the body by the way of the brain and nerve system (Jensen, 2011).
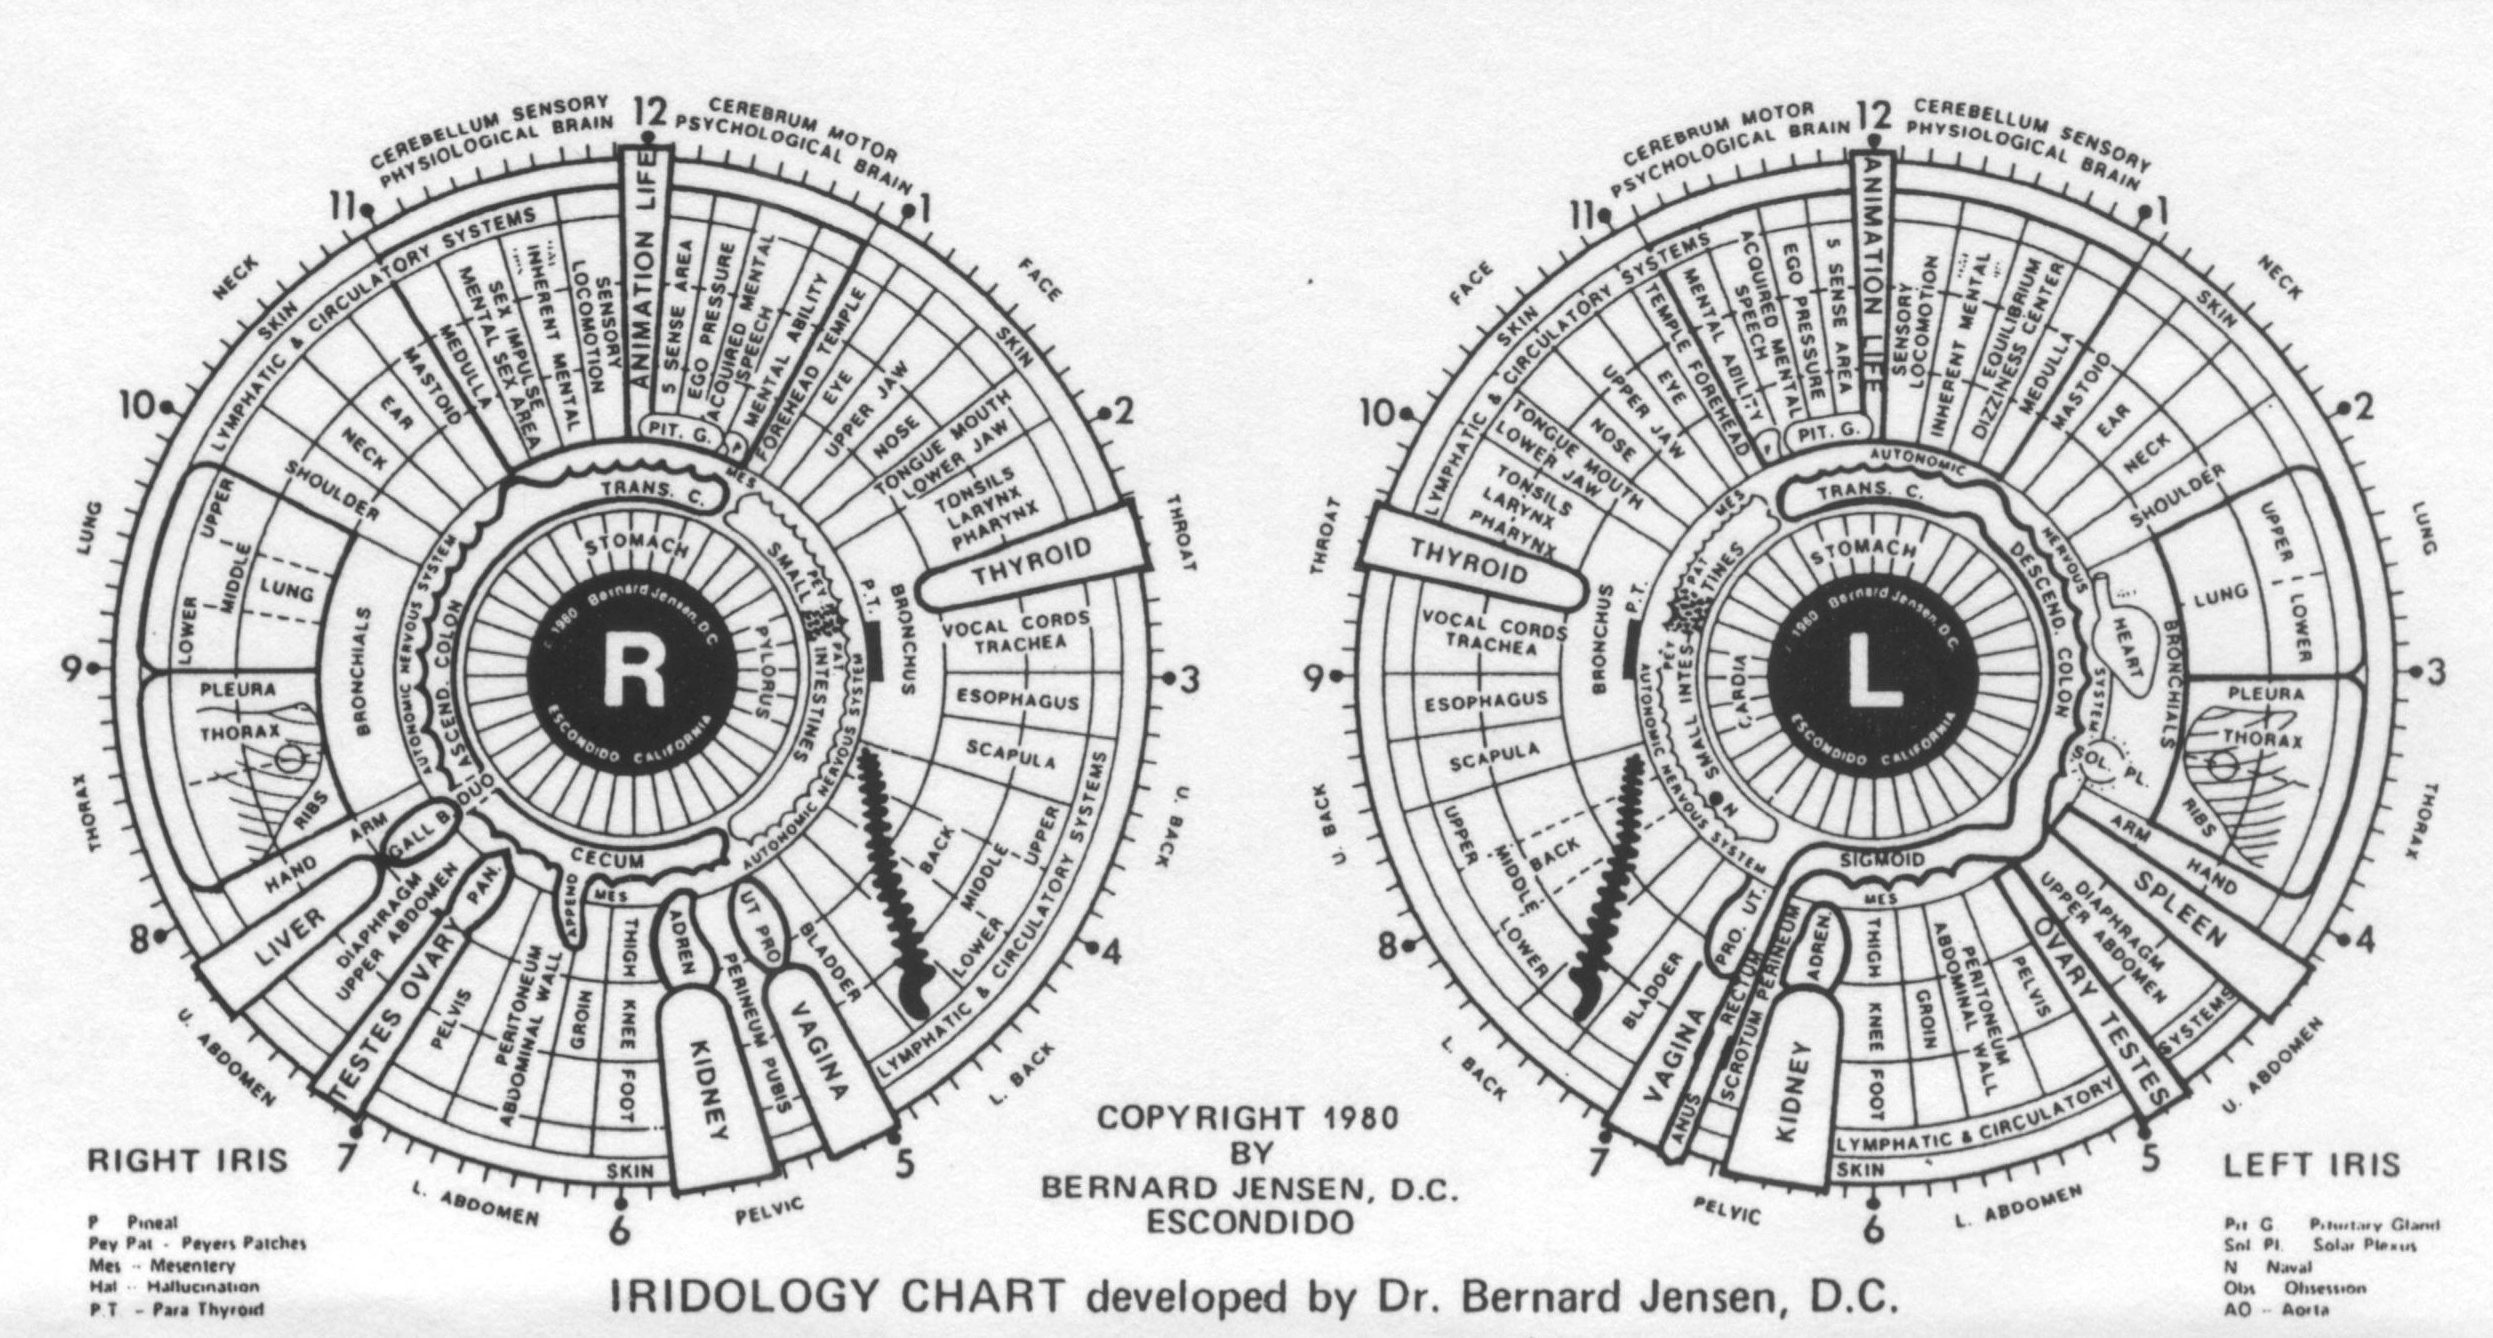
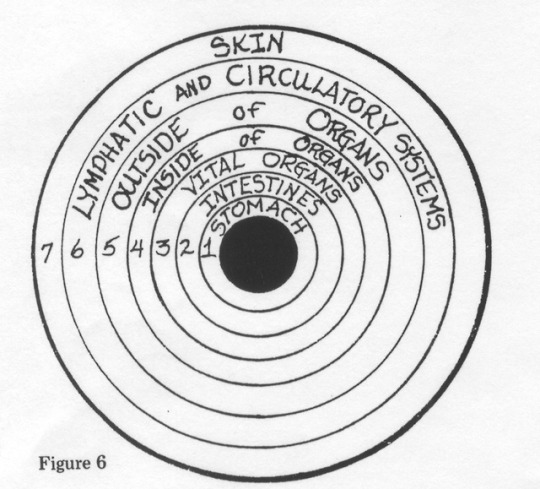
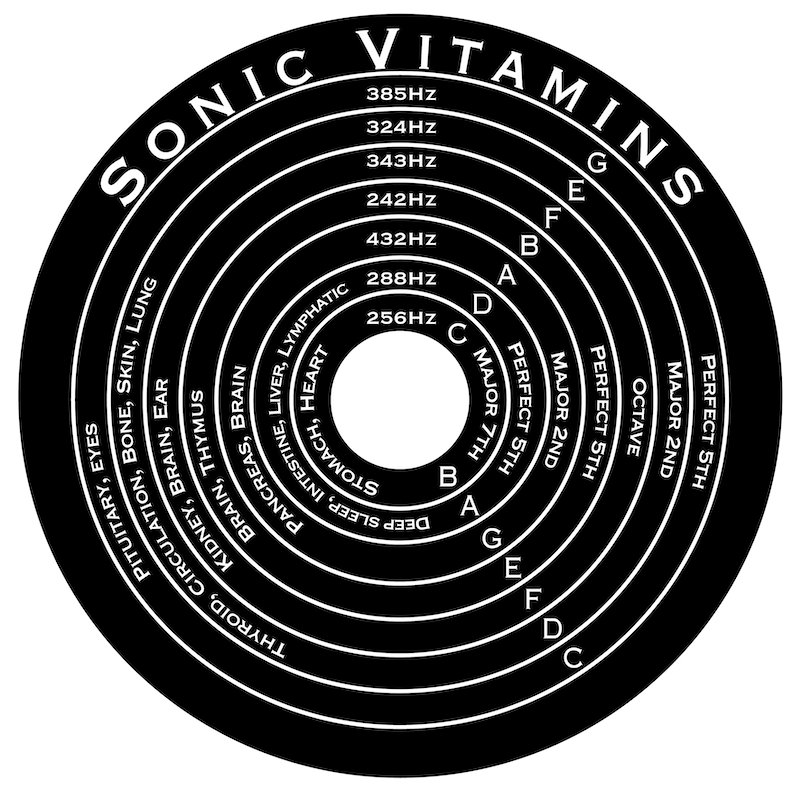
It is believed by iridologists that any detail can disclose and indicate the health status of a person. Because of this association, doctors and scientists started to map different areas in the iris to human organs and systems of the body. Iris maps keep evolving and modifying over the centuries. Dr. Bernard Jensen, who is known as a pioneer of iris analysis, presented one of the most comprehensive iris map(see above) and also a simplified topography, which divides the iris into 7 equal zones (see below) from the pupil border (Zone 1) to the Iris border (Zone 7). Specific body systems and body organs generally tend to be located in these concentric zones (Endeavour College of Natural Health, 2019):
- Zone 1 = The Stomach Zone (Zone of Digestion)
- Zone 2 = The Intestinal Zone (Zone of Absorption)
- Zone 3 = The Humoral Zone (Blood & Lymph)
- Zone 4 = The Muscle Zone (Zone of Utilization)
- Zone 5 = The Skeletal Zone (Zone of ultimate Utilization)
- Zone 6 = The Lymph Zone (Zone of Detoxification)
- Zone 7 = The Skin Zone (Zone of Elimination
I choose to use this 7 zones theory as the main reference to develop my healing system because it is easier for me to get data from the iris picture and then map the parameters in MaxMSP
Sound Healing in religious rituals
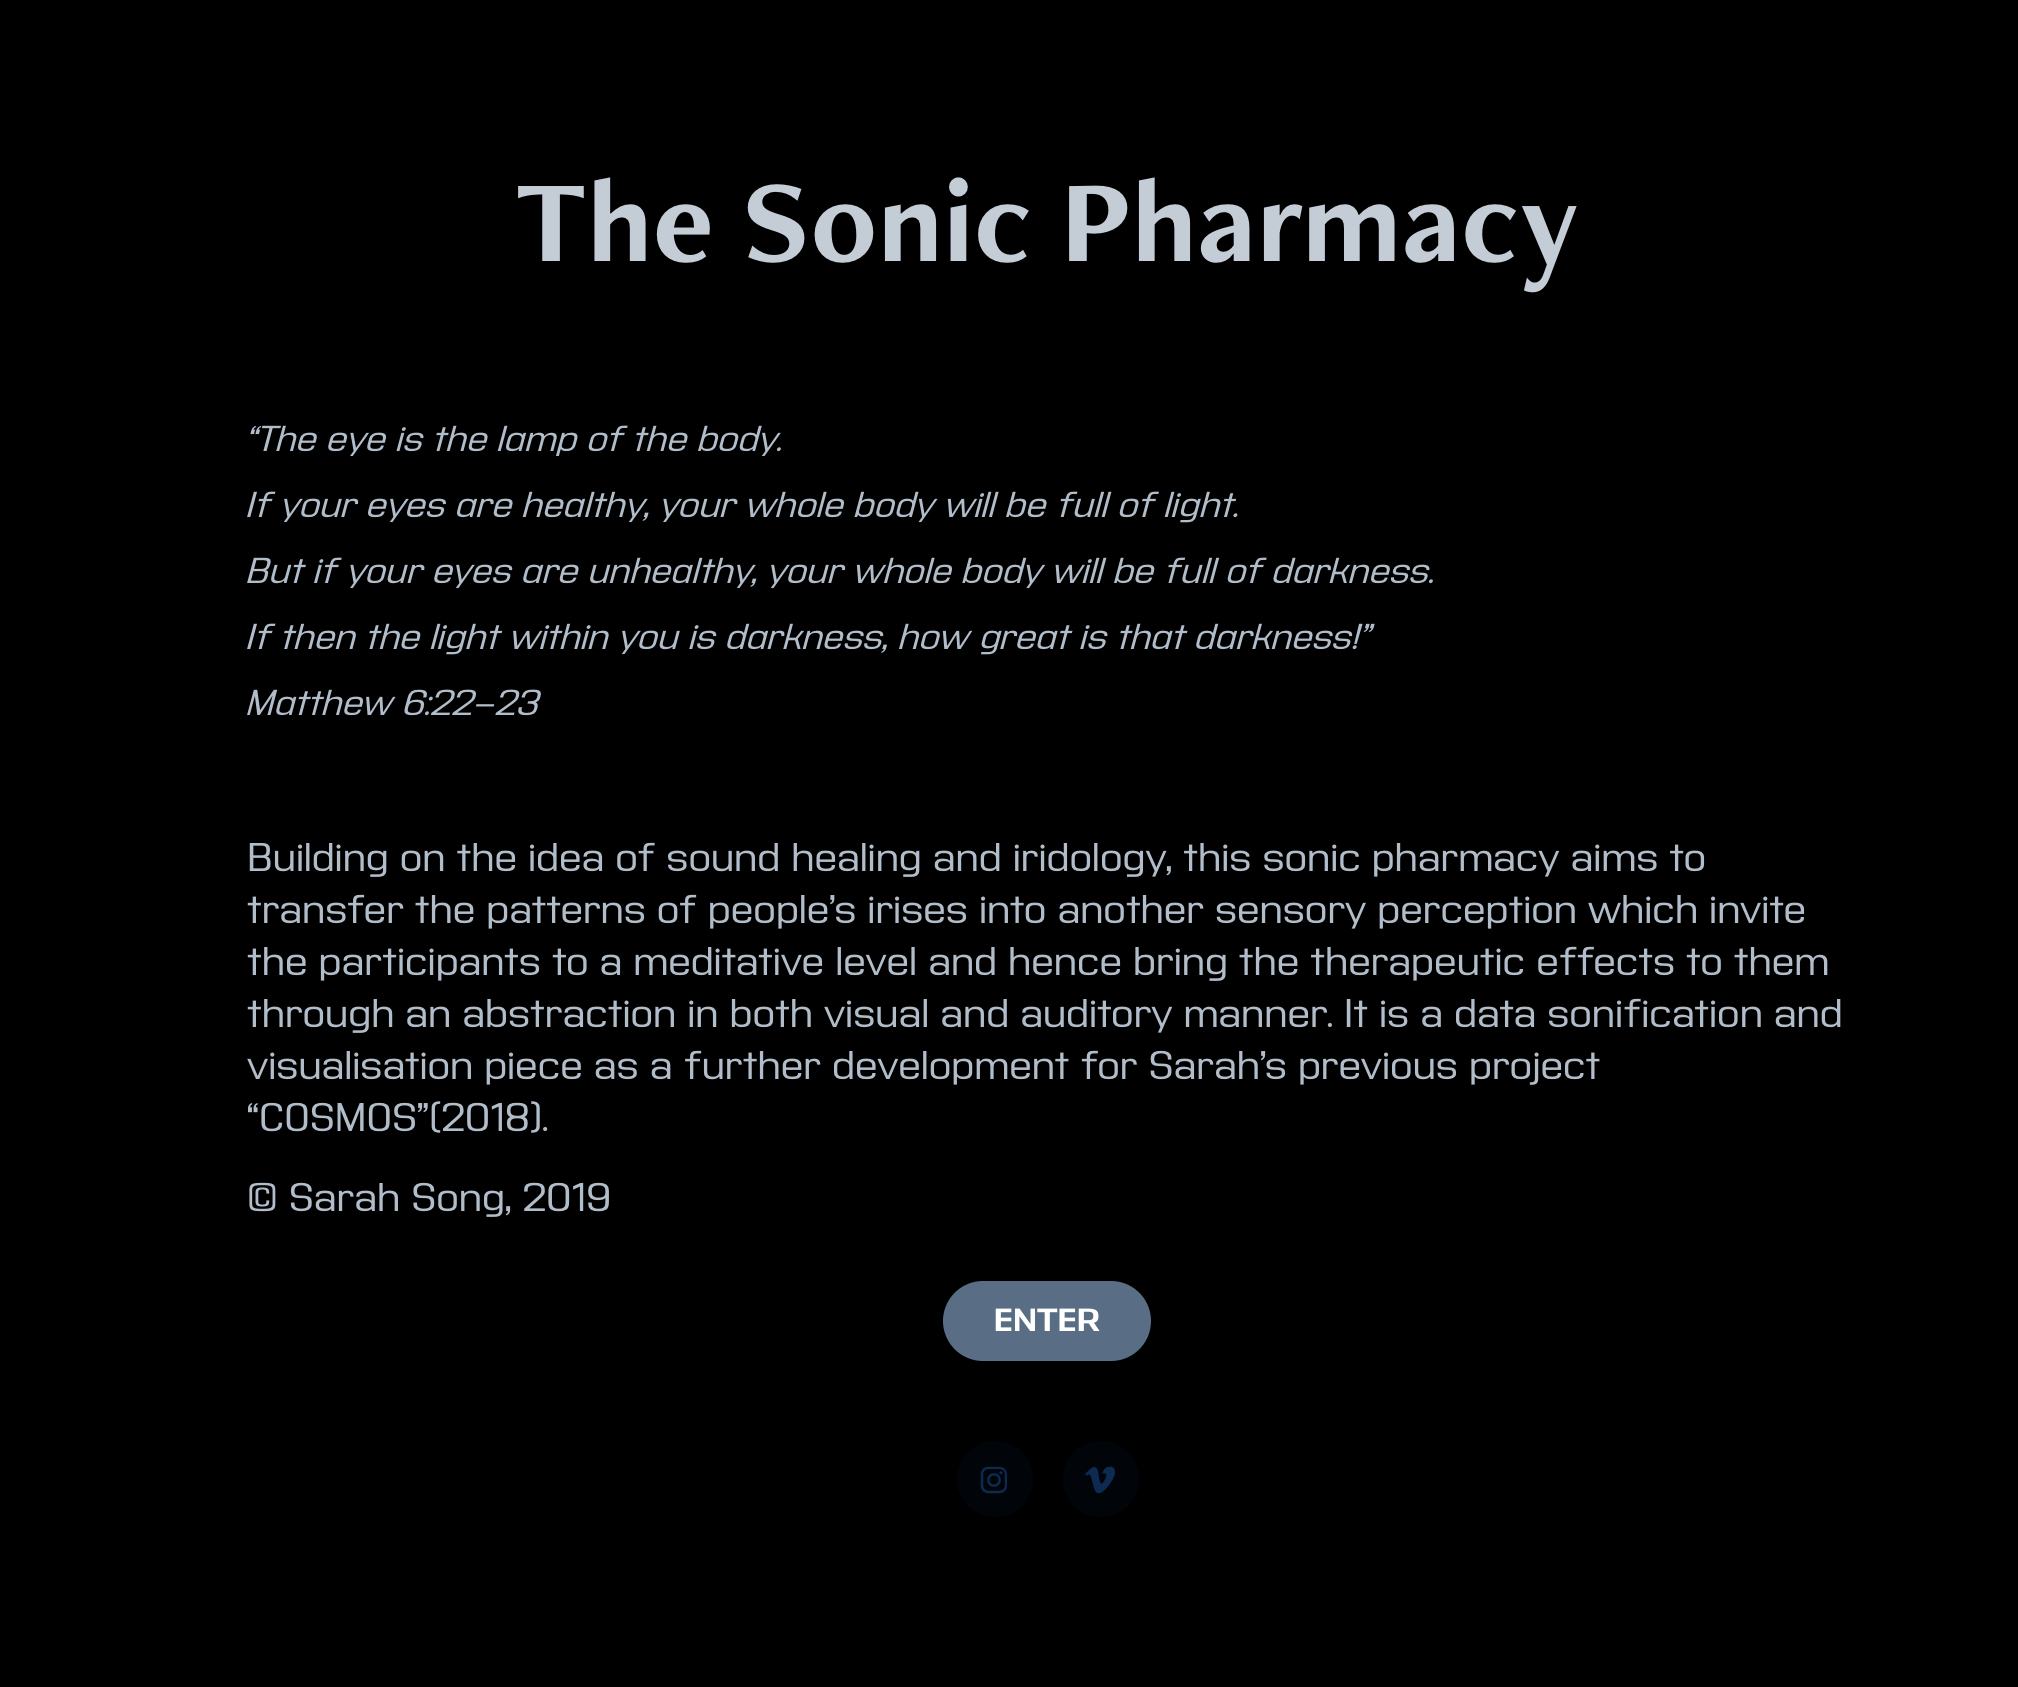
“The eye is the lamp of the body.
If your eyes are healthy, your whole body will be full of light.
But if your eyes are unhealthy, your whole body will be full of darkness.
If then the light within you is darkness, how great is that darkness!”
Matthew 6:22-23
Christian, Buddhist and Muslim apply a monotonal and rhythmic vocal chanting with or without words to achieve a state of deep meditation. Lots of researches suggest that sound can be used to help people recover from serious medical conditions as different frequencies target the various densities in the body and therefore the vibration which has been created can work on all parts of the body. In The Healing Forces of Music: History, Theory, and Practice, Randall McClellan said “each cell of the human body, then, produces a frequency or resonating harmonic.” And he also defines “sound healing” as an approach that “treats the body through resonance first and affects the emotions and mind second”. Lyz Cooper, the founder of The British Academy of Sound Therapy also mentioned in her book that therapeutic sound sessions bring people a sense of profound peace, the appreciation of the wonder of existence and our part in it. Deeply inspired by the sound healing concept, I think it is a nice way to combine sound healing with iridology so that people can get a customised and unique sonic treatment for themselves. Specific frequency/sound can be triggered if a health problem is detected during the iris scan process. The idea is to generate those sound which can resonate with people physically that creates a sense of interconnection with sound therapy and iridology in order to guide people into a calmer and deeper meditative state.
Iridolody with Sound Healing
In terms of the relationship between our health status and our own body, what we hear also has an impact on our body.
“Everything in Life is Vibration,” - Albert Einstein
A sound signal itself is one-dimensional, yet it is rich in sonic information. Living in a vibratory universe, every sound is a vibration hence it is measured in terms of frequency and can be mathematically calculated. This is the universal law of nature, which we all agree. I see sound as audible energy and can affect us in many ways. Sound healing usually involves the direct impact of physical, acoustical vibrations on bodily structures, physiological functioning, and neural activity (Goldman, 1992). That is to say, the concept of resonance is a key element in sound healing. Every organ and cell of the body can resonant with a specific frequency that may bring the healing effect. It is familiar to me that I can literally feel the vibration of bass sound and rhythmic beats when I was in some music performances and concerts. I naturally reacted to the music and really enjoy that kind of feeling sometimes. Randall McClellan stated in his book that human beings increase their abilities of internal scanning, concentration and channeling by experiencing the resonant process. “Channeling” is a method of energy transference that one may help another in a healing situation through the process of “channeling” (McClellan, 2000). Based on these statements, I want to present a positive self-transformation idea in order to arouse people’s consciousness about a fundamental interrelationship between us and the environment we live in.
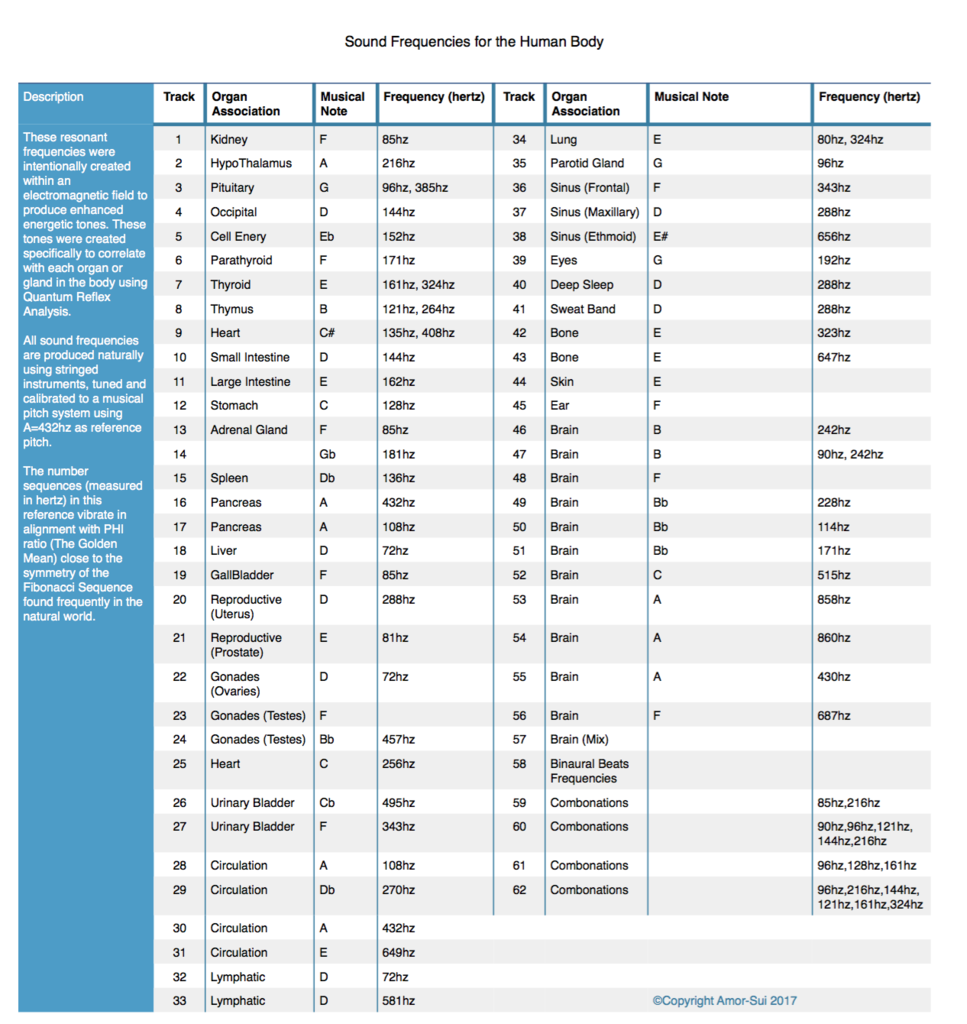
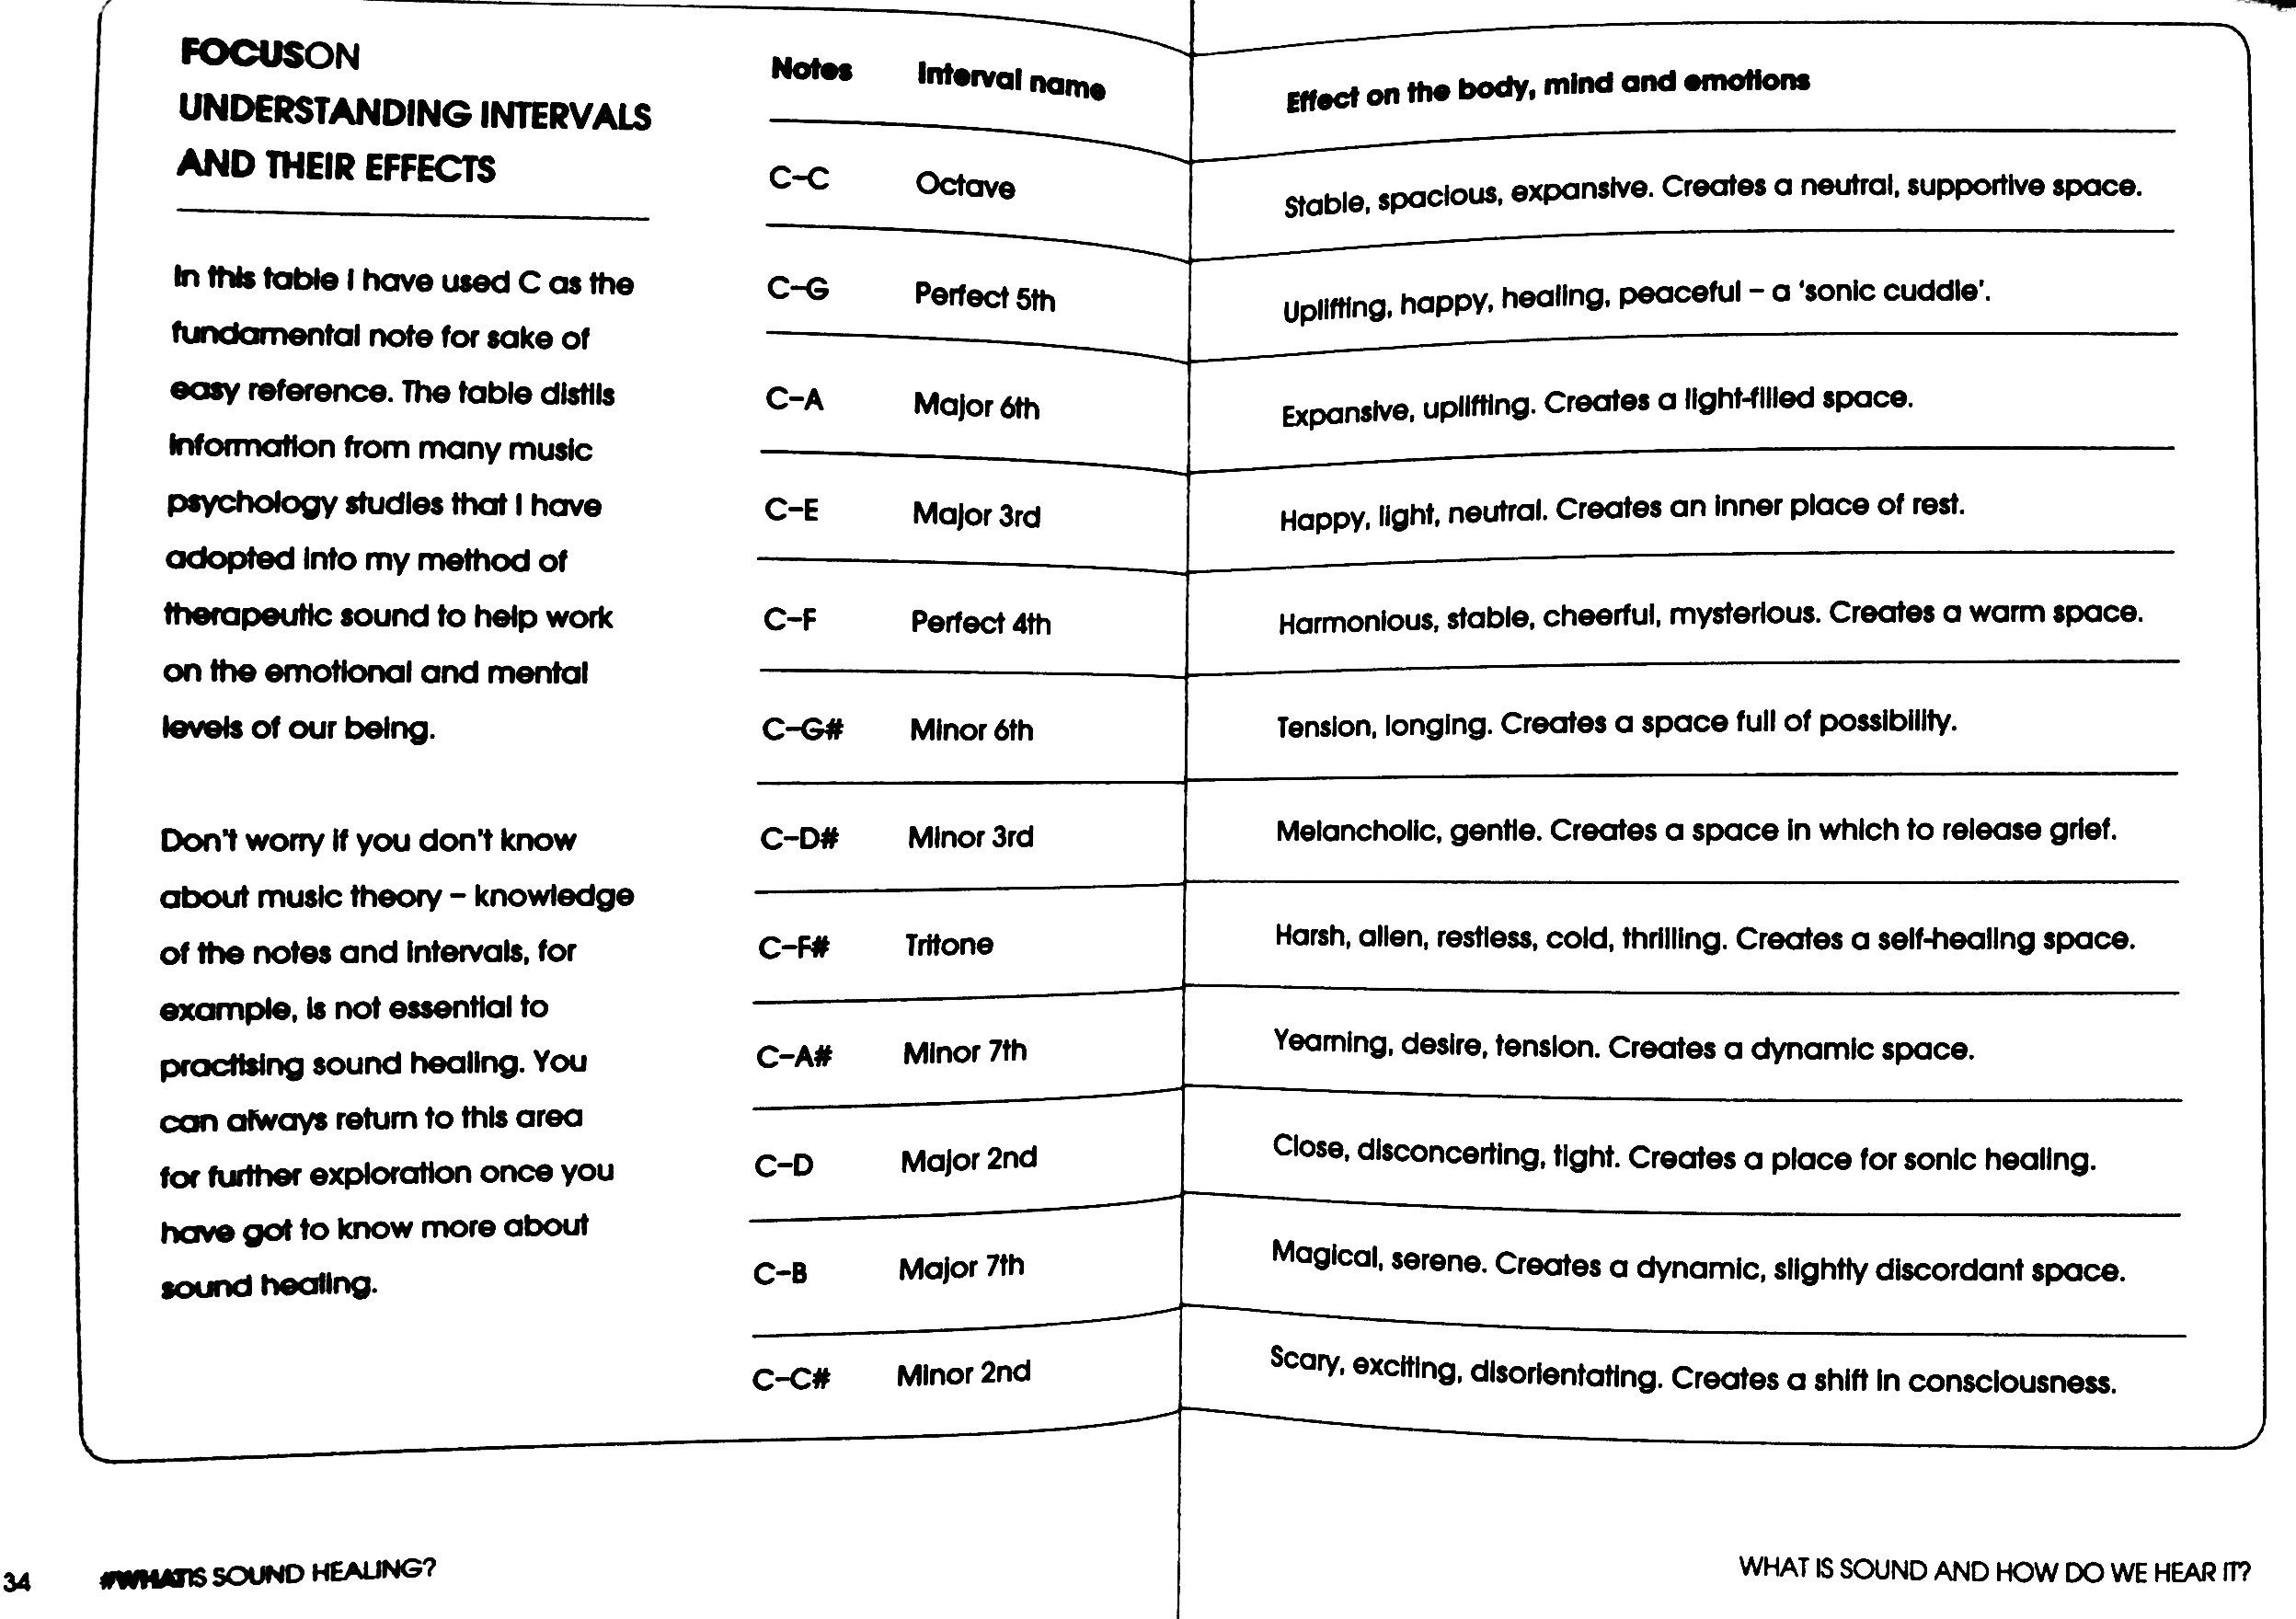
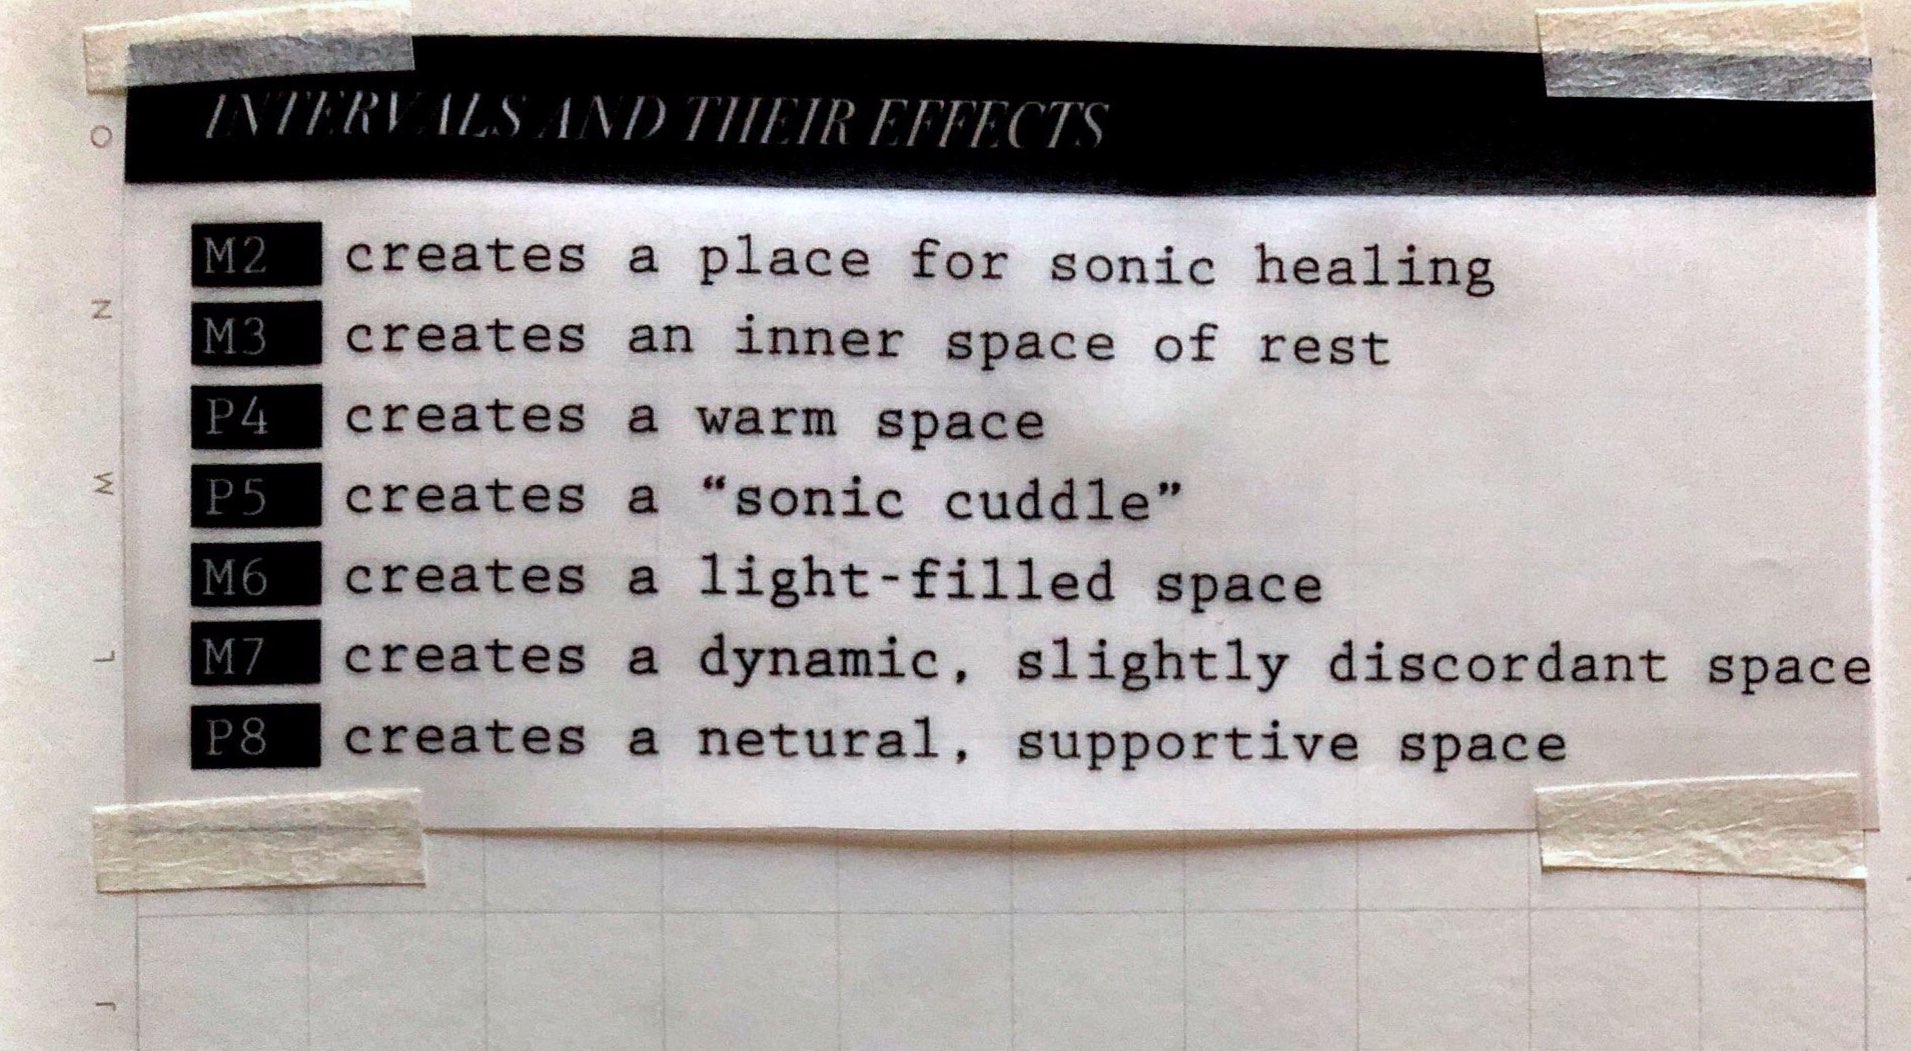
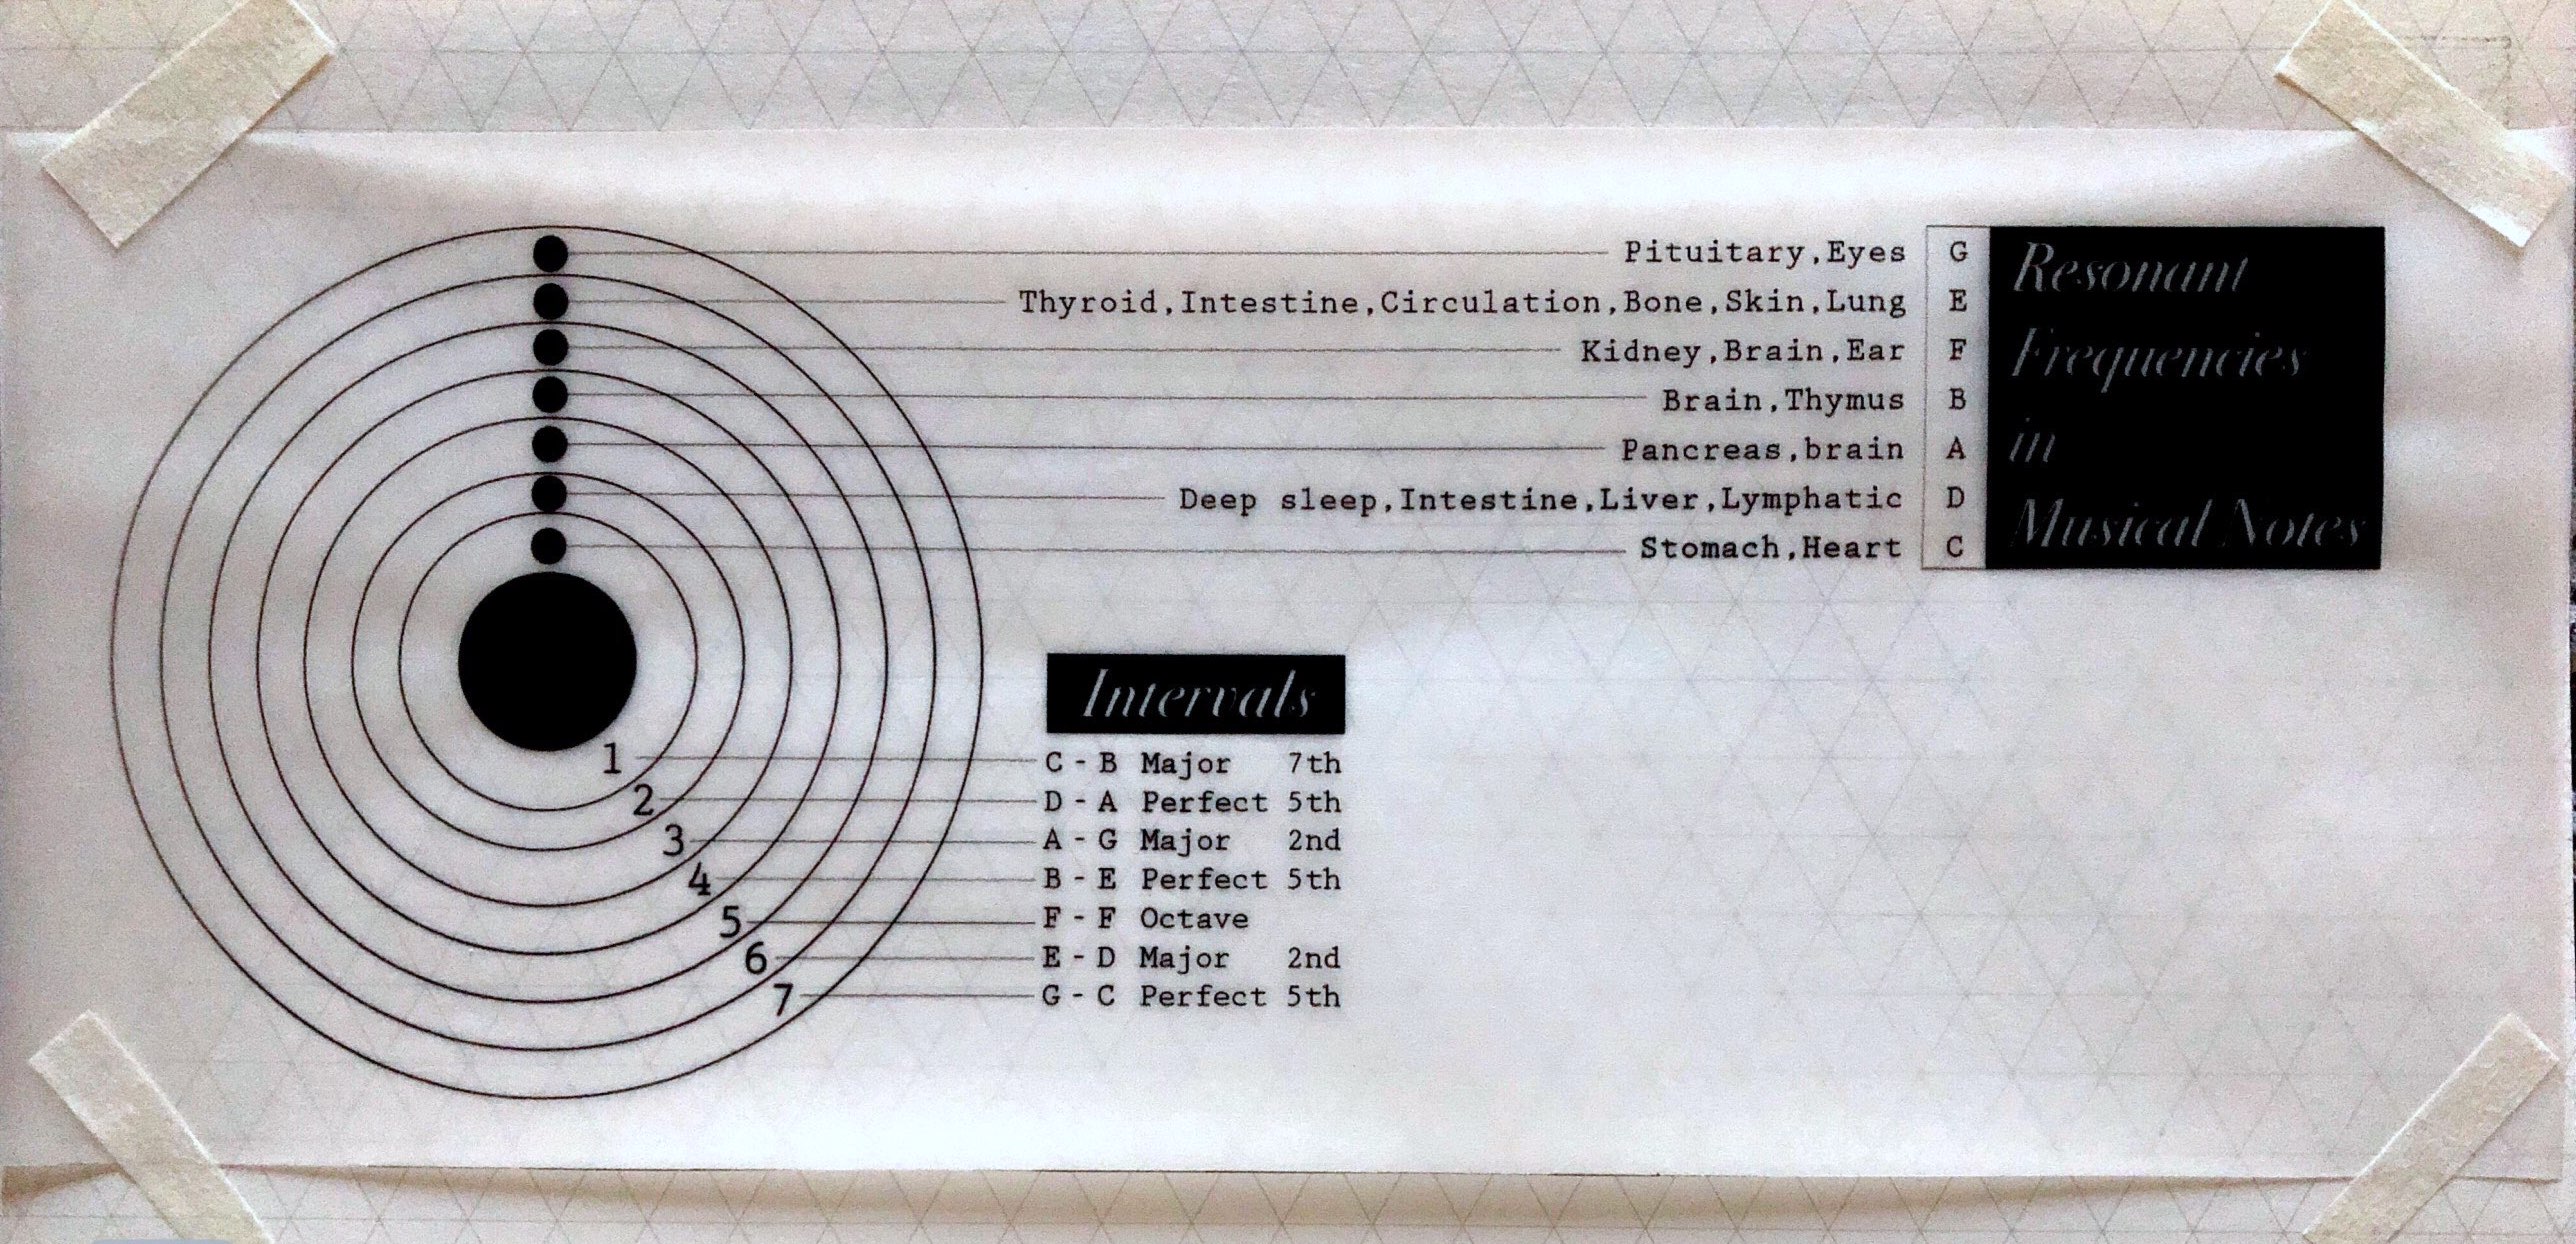
I found a lab research result by Amor-Sui, who claim themselves as the world leader in cell resonant nutrition made this table that shows those resonant frequencies specifically created to correlate with each organ or gland in the body. In the first picture shown below, the A note = 432hz (the modern standard is A = 440 Hz), which in the sound healing world, it is also known as the ‘God’ Note. You will find lots of mystical arguments about why 432hz is nonsense and why it has healing power online. I find this quite interesting but would like to find more idea about sound healing. Here is a therapeutic interval theory proposed by Lyz Cooper in her book “What Is Sound Healing?”(the 2nd pic below). She focuses on the relationship between two musical notes which has different frequencies and how they simultaneously and sustained for the same period of time will create such a healing effect on people.
Sound visualization (Graphical transformation)
Sound visualization, by definition, is the generation of imagery based on music data (Pramerdorfer, 2011). Historically, Higgens observed the effect of the sound from candle flame in the late 1700s. From this time on, sound visualization has been used as a method of sound analysis. Sound visualization changes those abstract features like pitch, timbre and duration into tangible forms in the visual domain. Up to now, diverse visual representations and visualization approaches have been created to help us quickly gain understandings of sonic data and recognize the patterns at a glance. Generally speaking, there are two major ways to display sound data in this raw form: in the time domain and frequency domain.
Apart from other visual representations, for instance, spectrogram, 3D graphics and even so-called Cymatic patterns, it is interesting to look into how sound has been visualized from artists and musicians’ perspectives. French artist Hélène Goddyn made medical imagery, mandala to trigger dream, reflection, questioning and spiritual elevation, inviting the audience to discover the beauty of our deep nature (Goddyn, 2013). Composers such as Karlheinz Stockhausen, John Cage, Earl Brown, and Cornelius Cardew are regarded as pioneers in music notation. They were all involved with graphic scoring in their careers. Most of this type of music scores have no further explanation for instruction to play, therefore, it is also considered an experimental practice.
I take graphic scores as one of the special visual means. They represent a piece of music in 2-dimentinal images but different from sheet music. There are two main reasons why I choose graphic notation as a technique to visualize sound:
- Iris is a kind of personal identification that needs to be carefully dealt with. It is better not to show the captured iris picture of the audience in high resolution for privacy reasons.
- Graphic scores have also been used in music therapy, which can “provide insight into the therapeutic process and assist the therapist in clinical decision-making” (Bergstrom-Nielsen, 1993, p43).
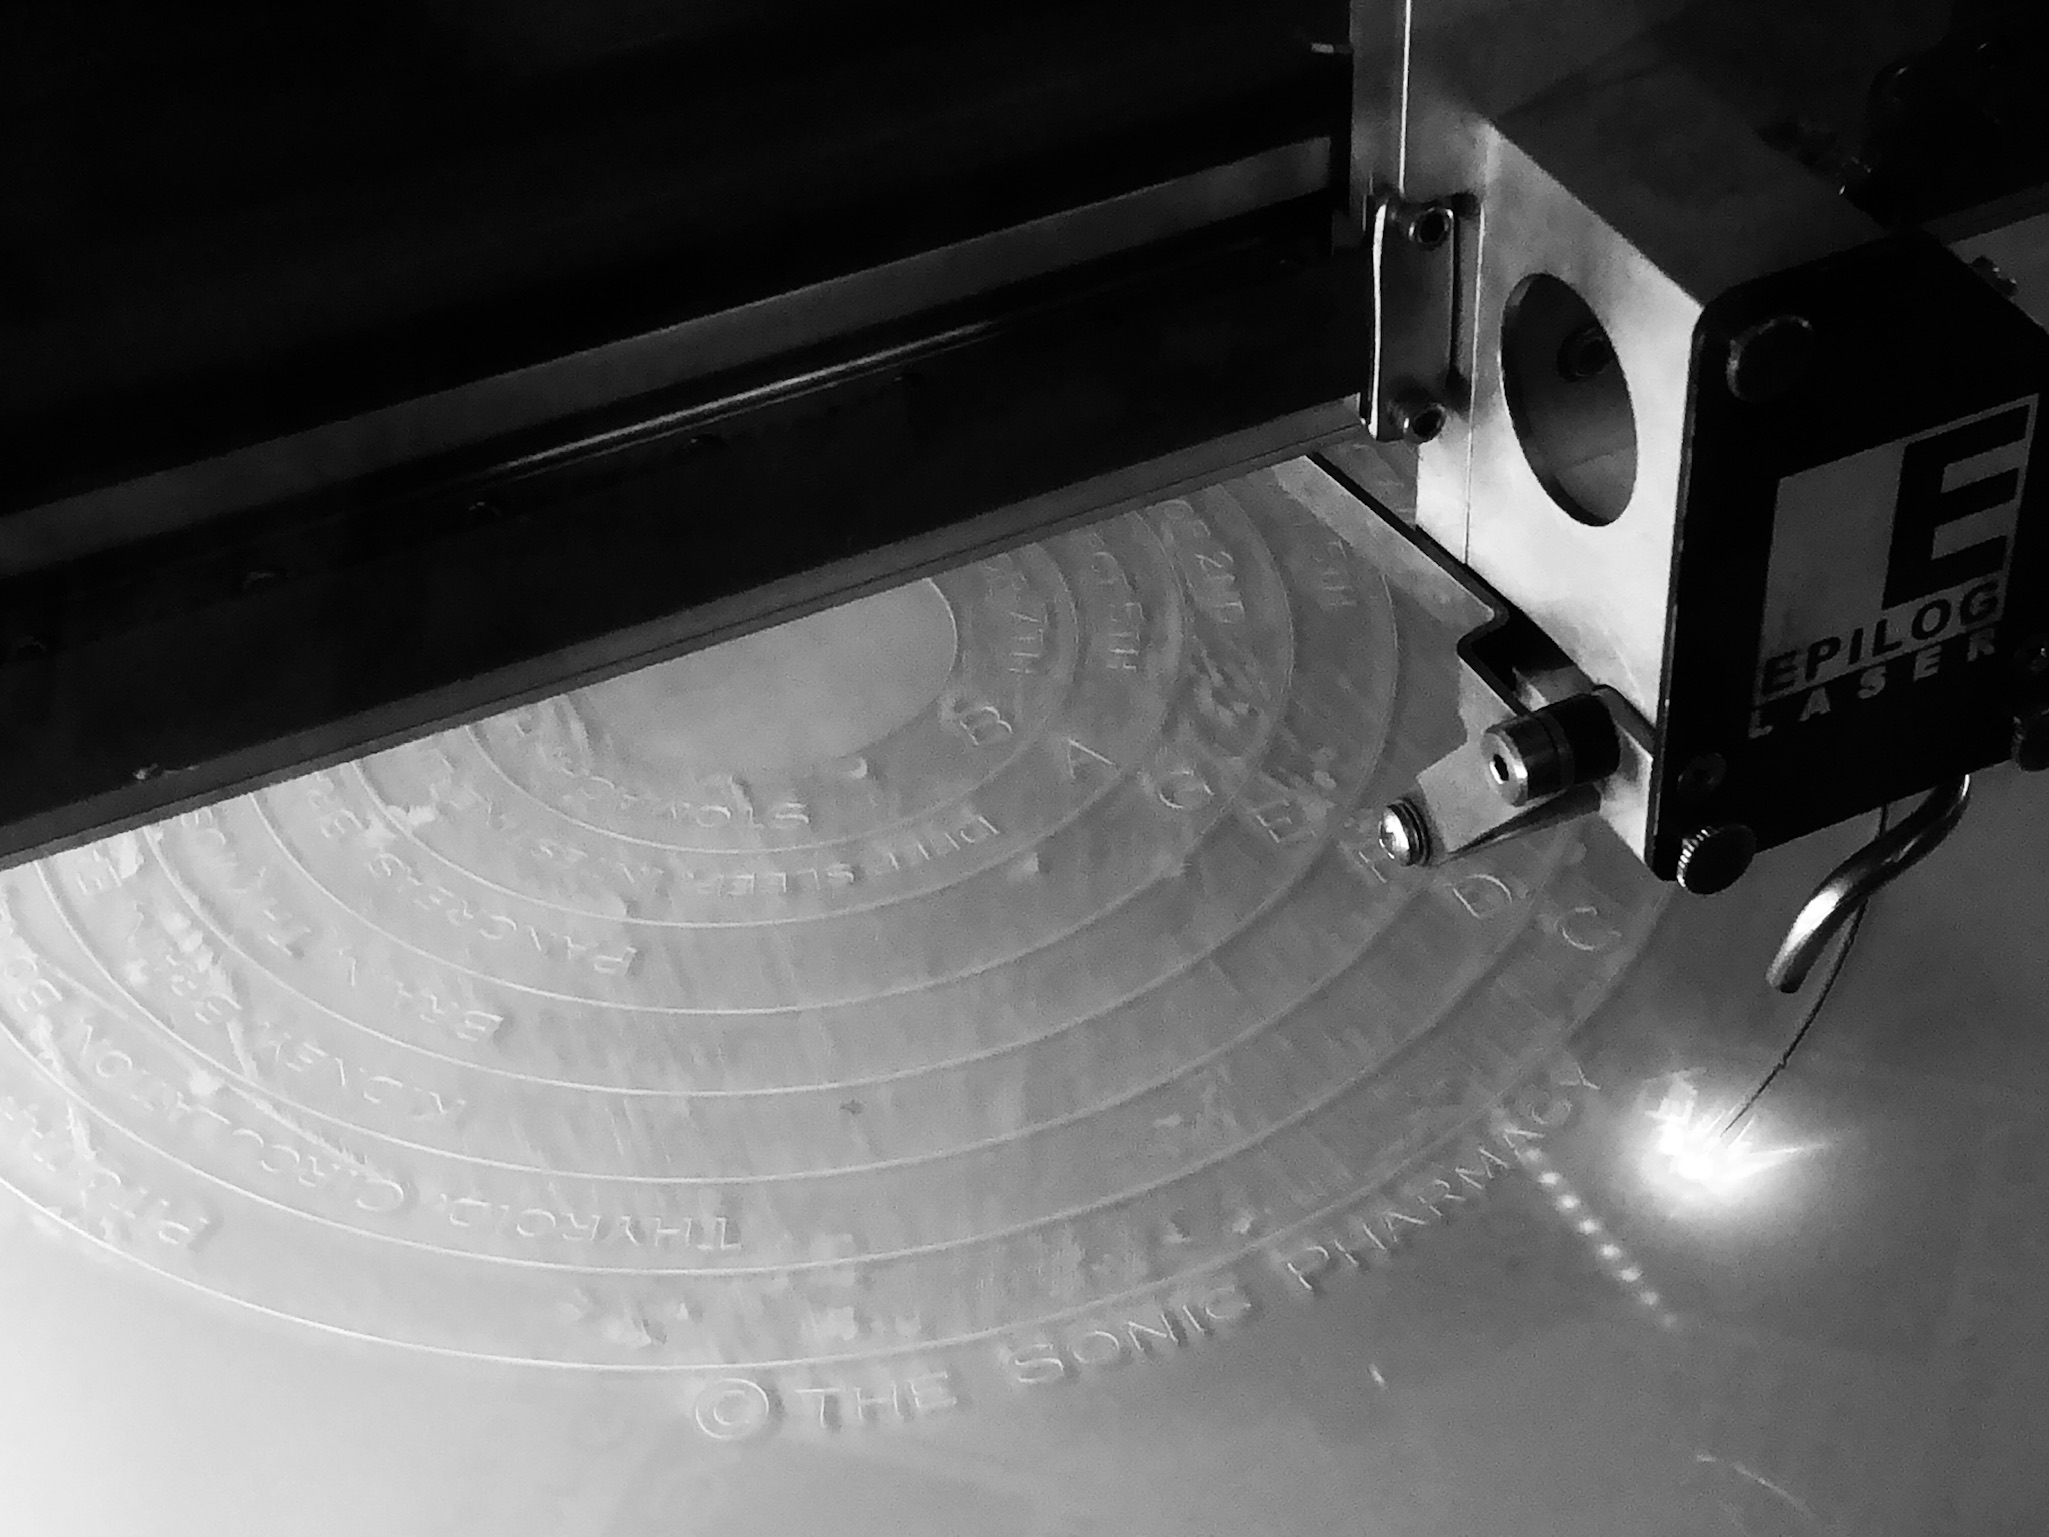
Technical
Operational procedures for The Sonic Pharmacy:
- To capture a clear iris image with a USB microscope
- To greyscale the image for scanning pixel data
- To send iris data from OF to Max/MSP via Open Sound Control (OSC)
- To sonify the image and visualize sound in real-time
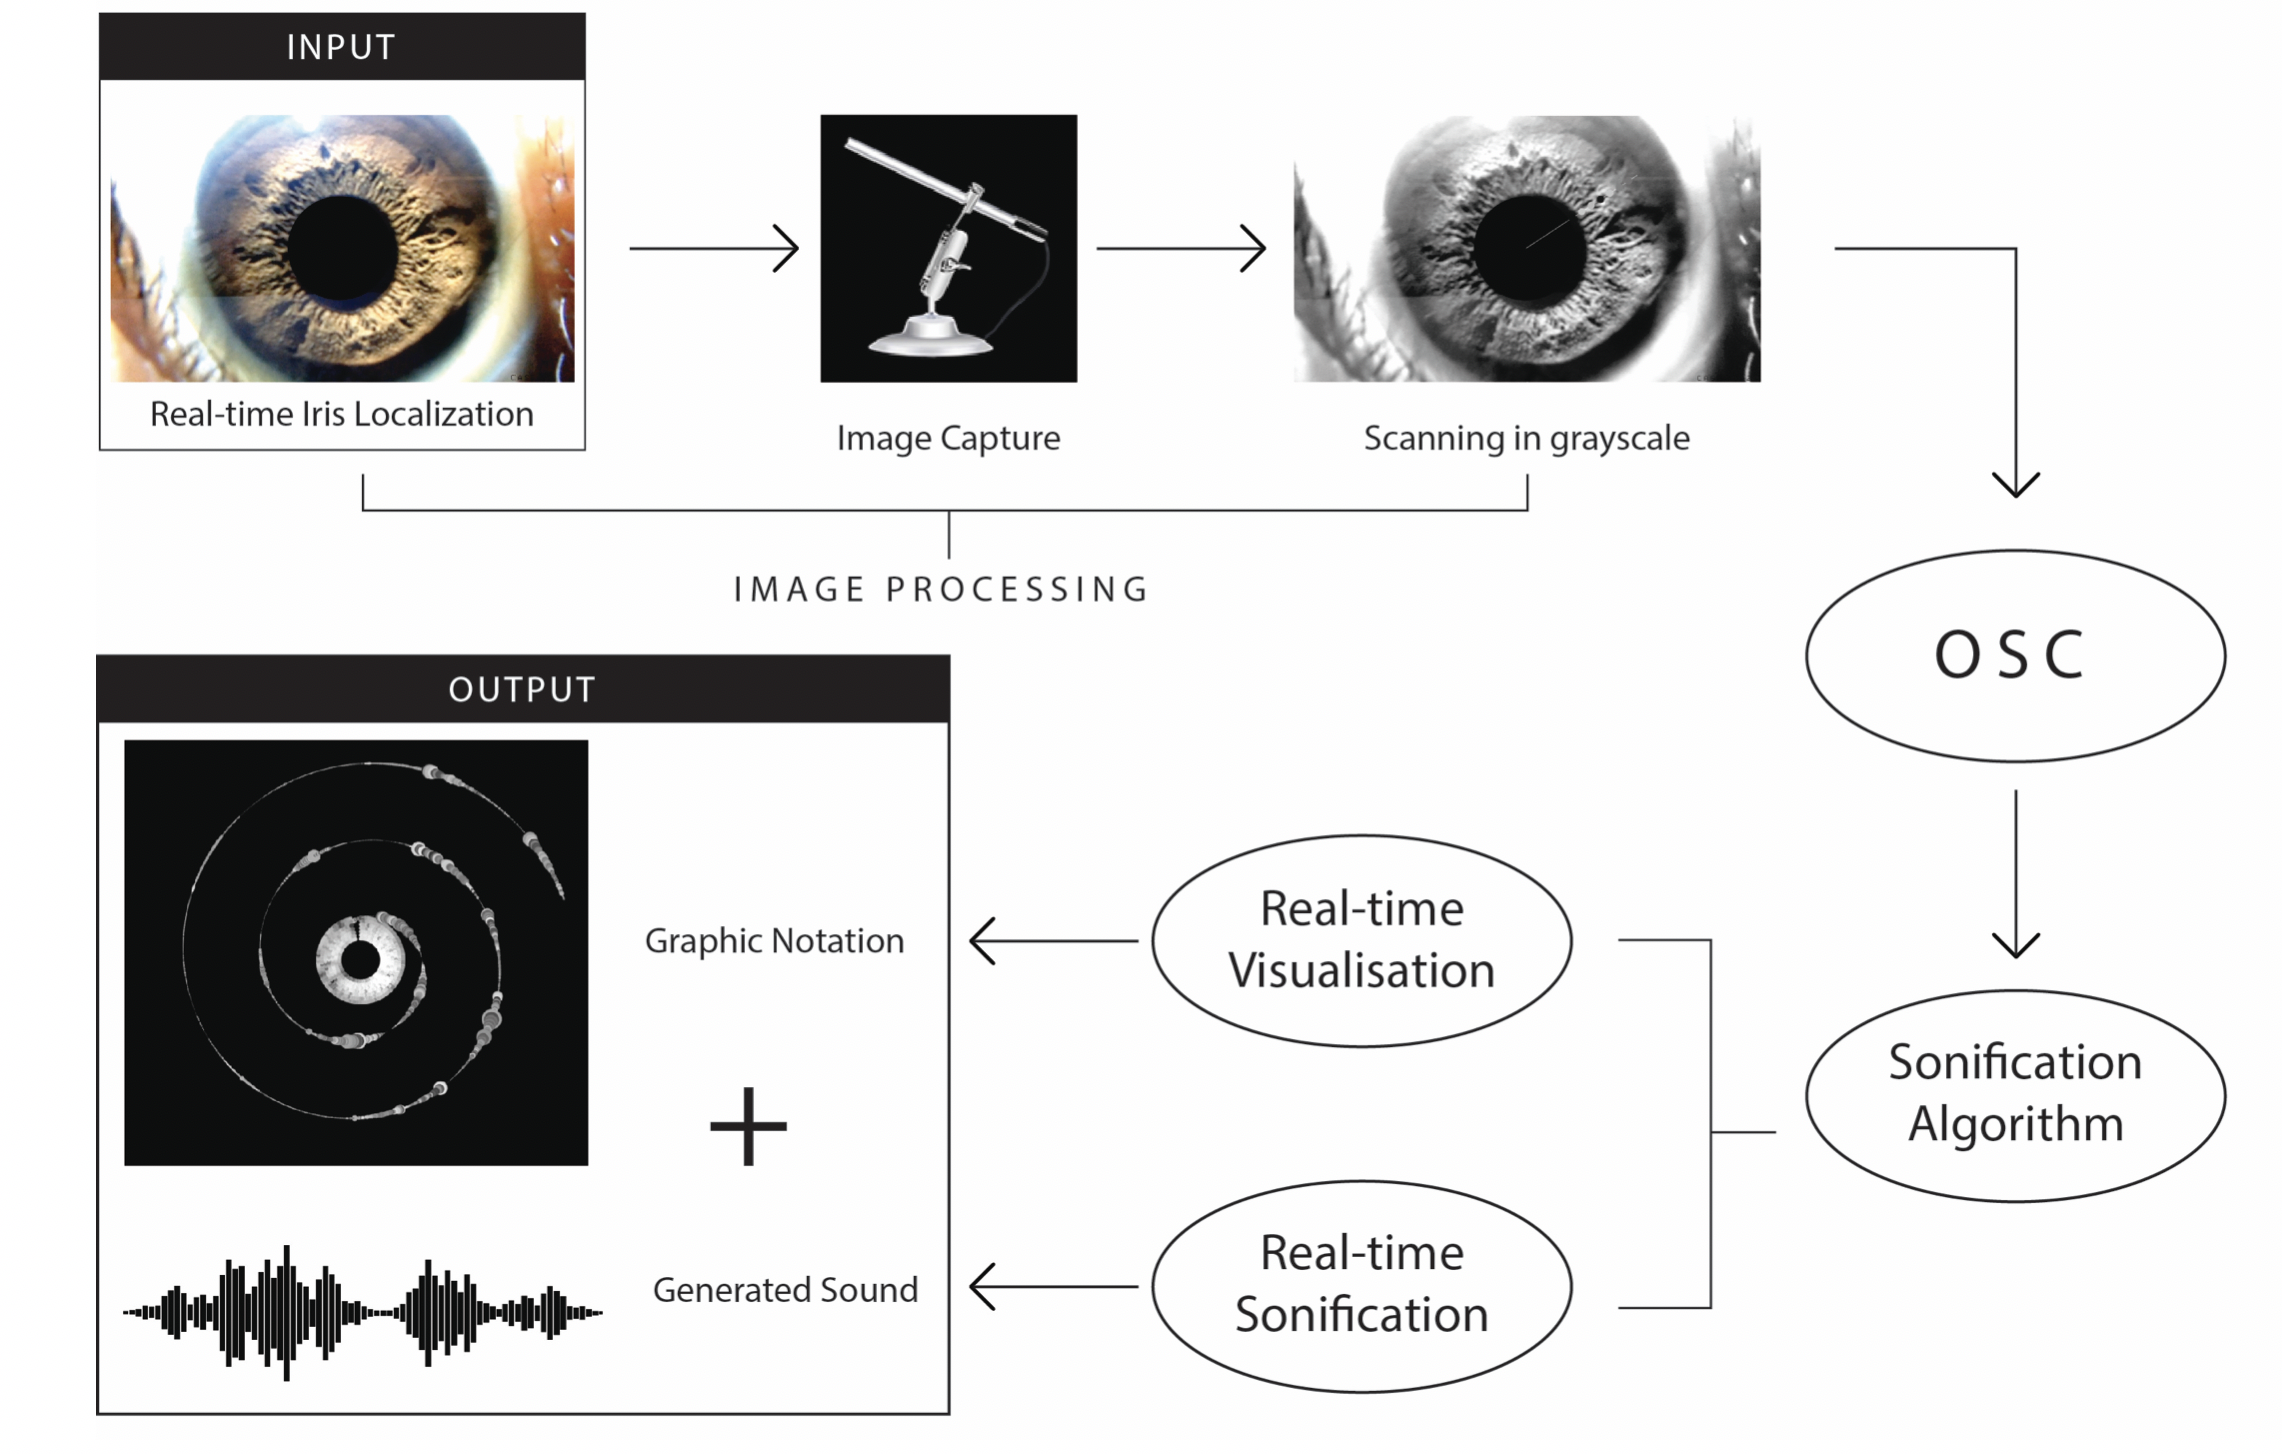
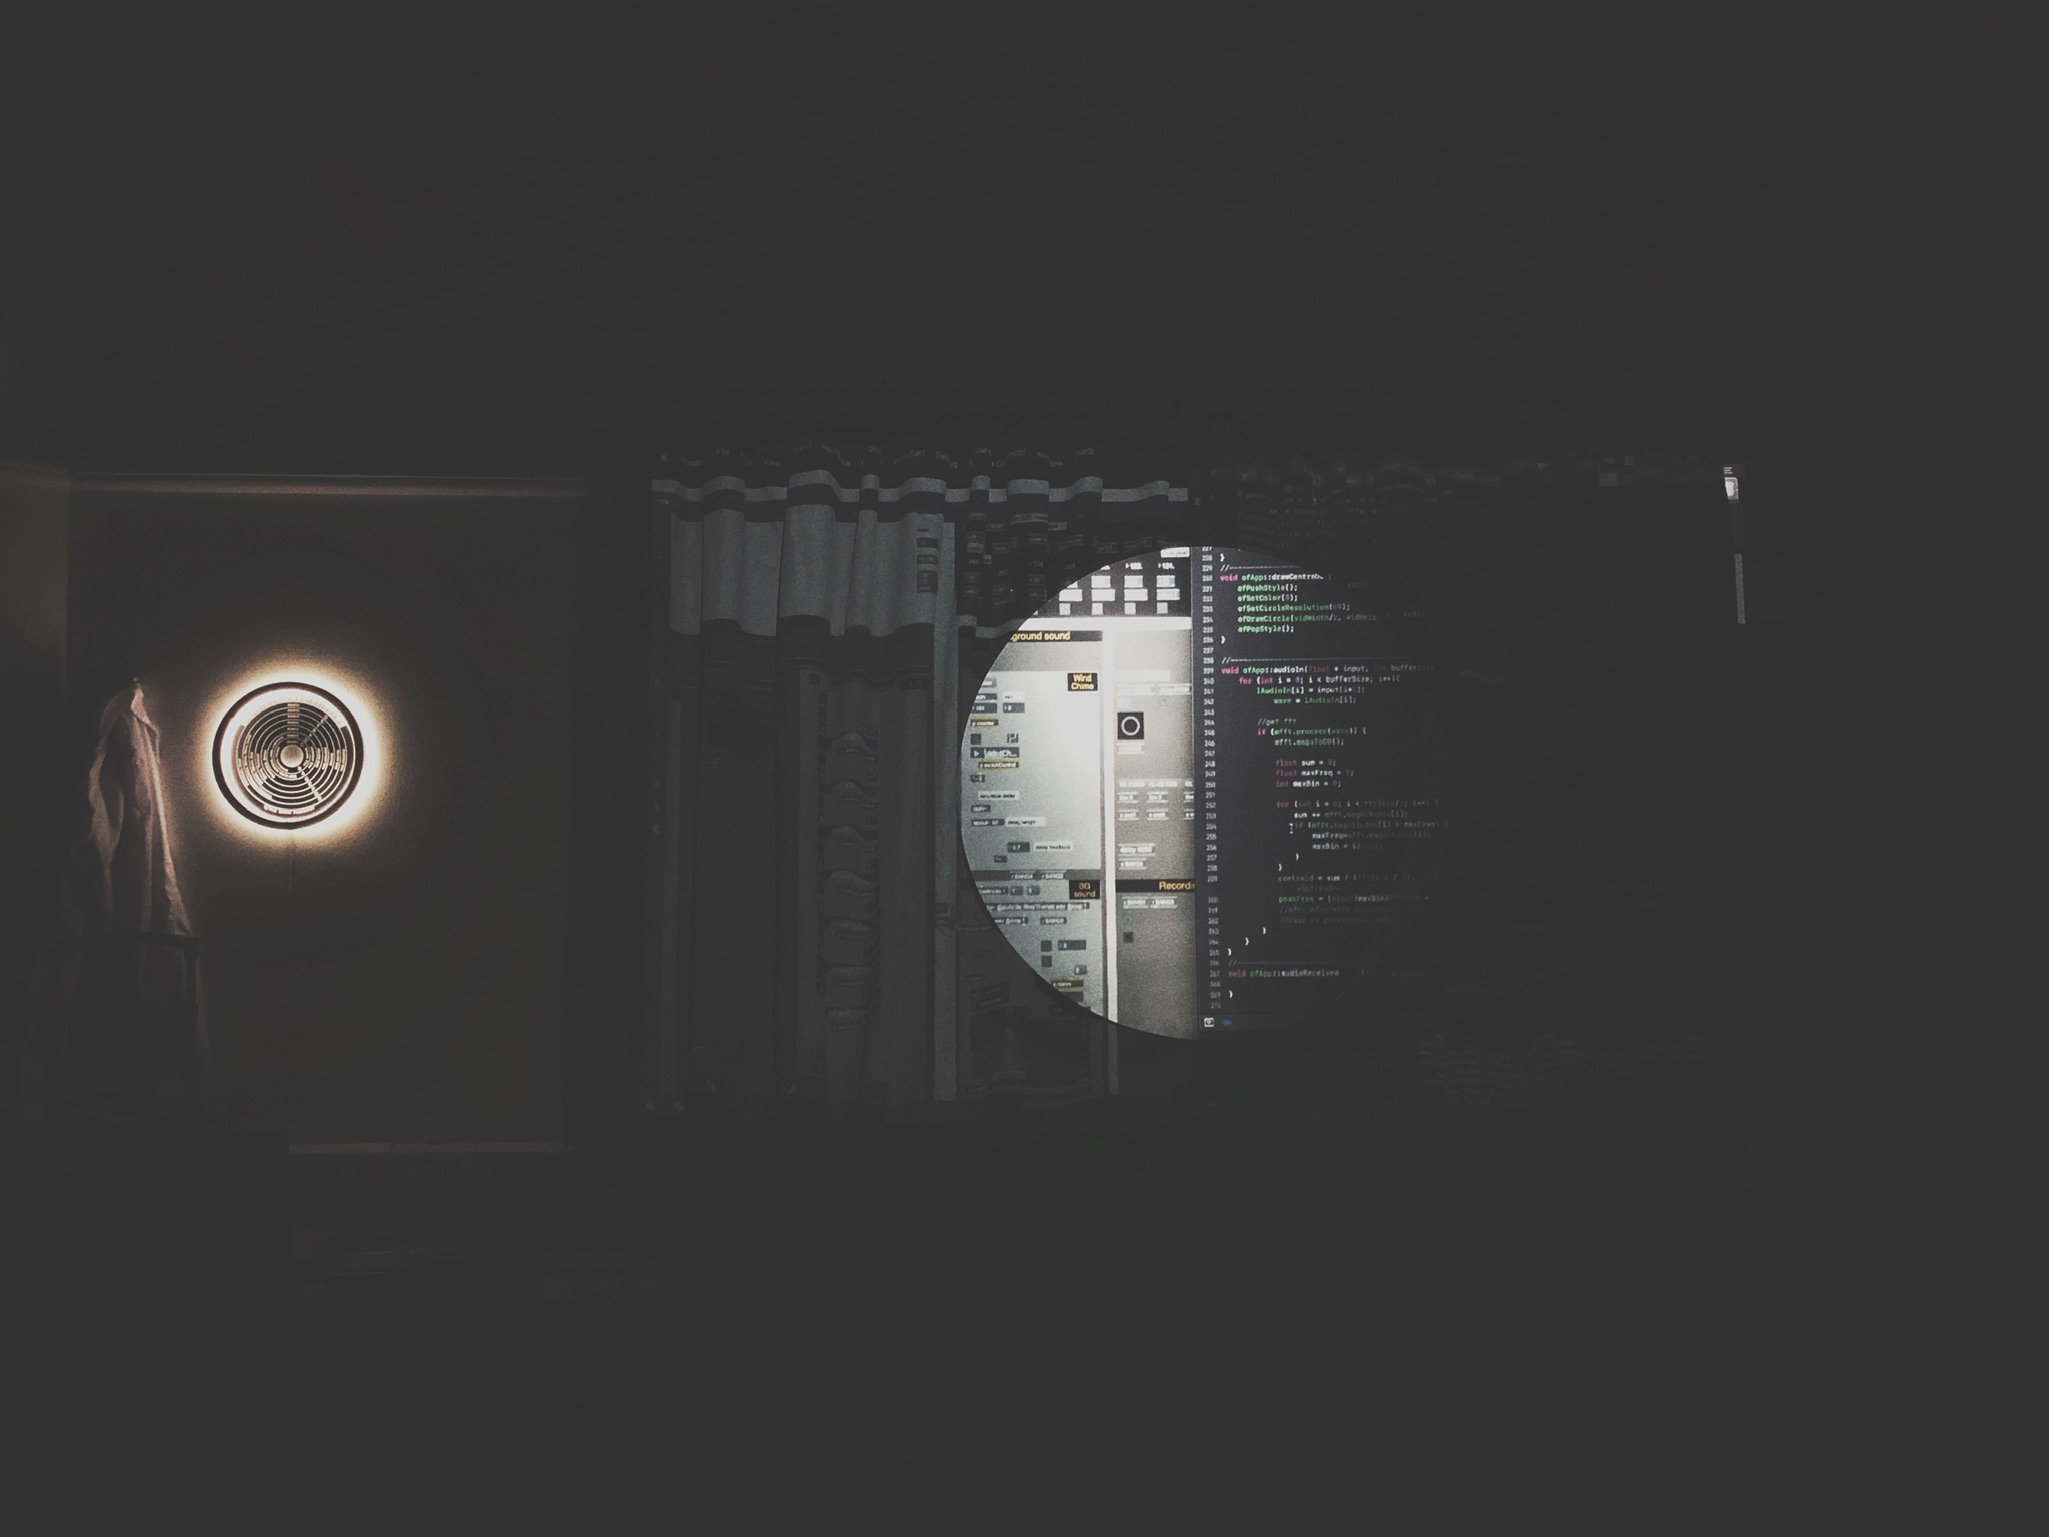
Image sonification
In this artefact, all the image processing is done in OF and the sonification is implemented in Max/MSP. Firstly, I grab an image from the live camera (digital microscope) and the image is then converted into a greyscale image and saved into the data file. A scanning line will rotate in 360 degrees and extract 7 pixel’s colour values (r, g and b are the same value in greyscale mode), and these data are sent via OSC message to the Max/MSP in every 120 frames (this also creates the rhythm). The whole sonic treatment is going to be 2 mins and the “sonic prescription” has consisted of 4 parts:
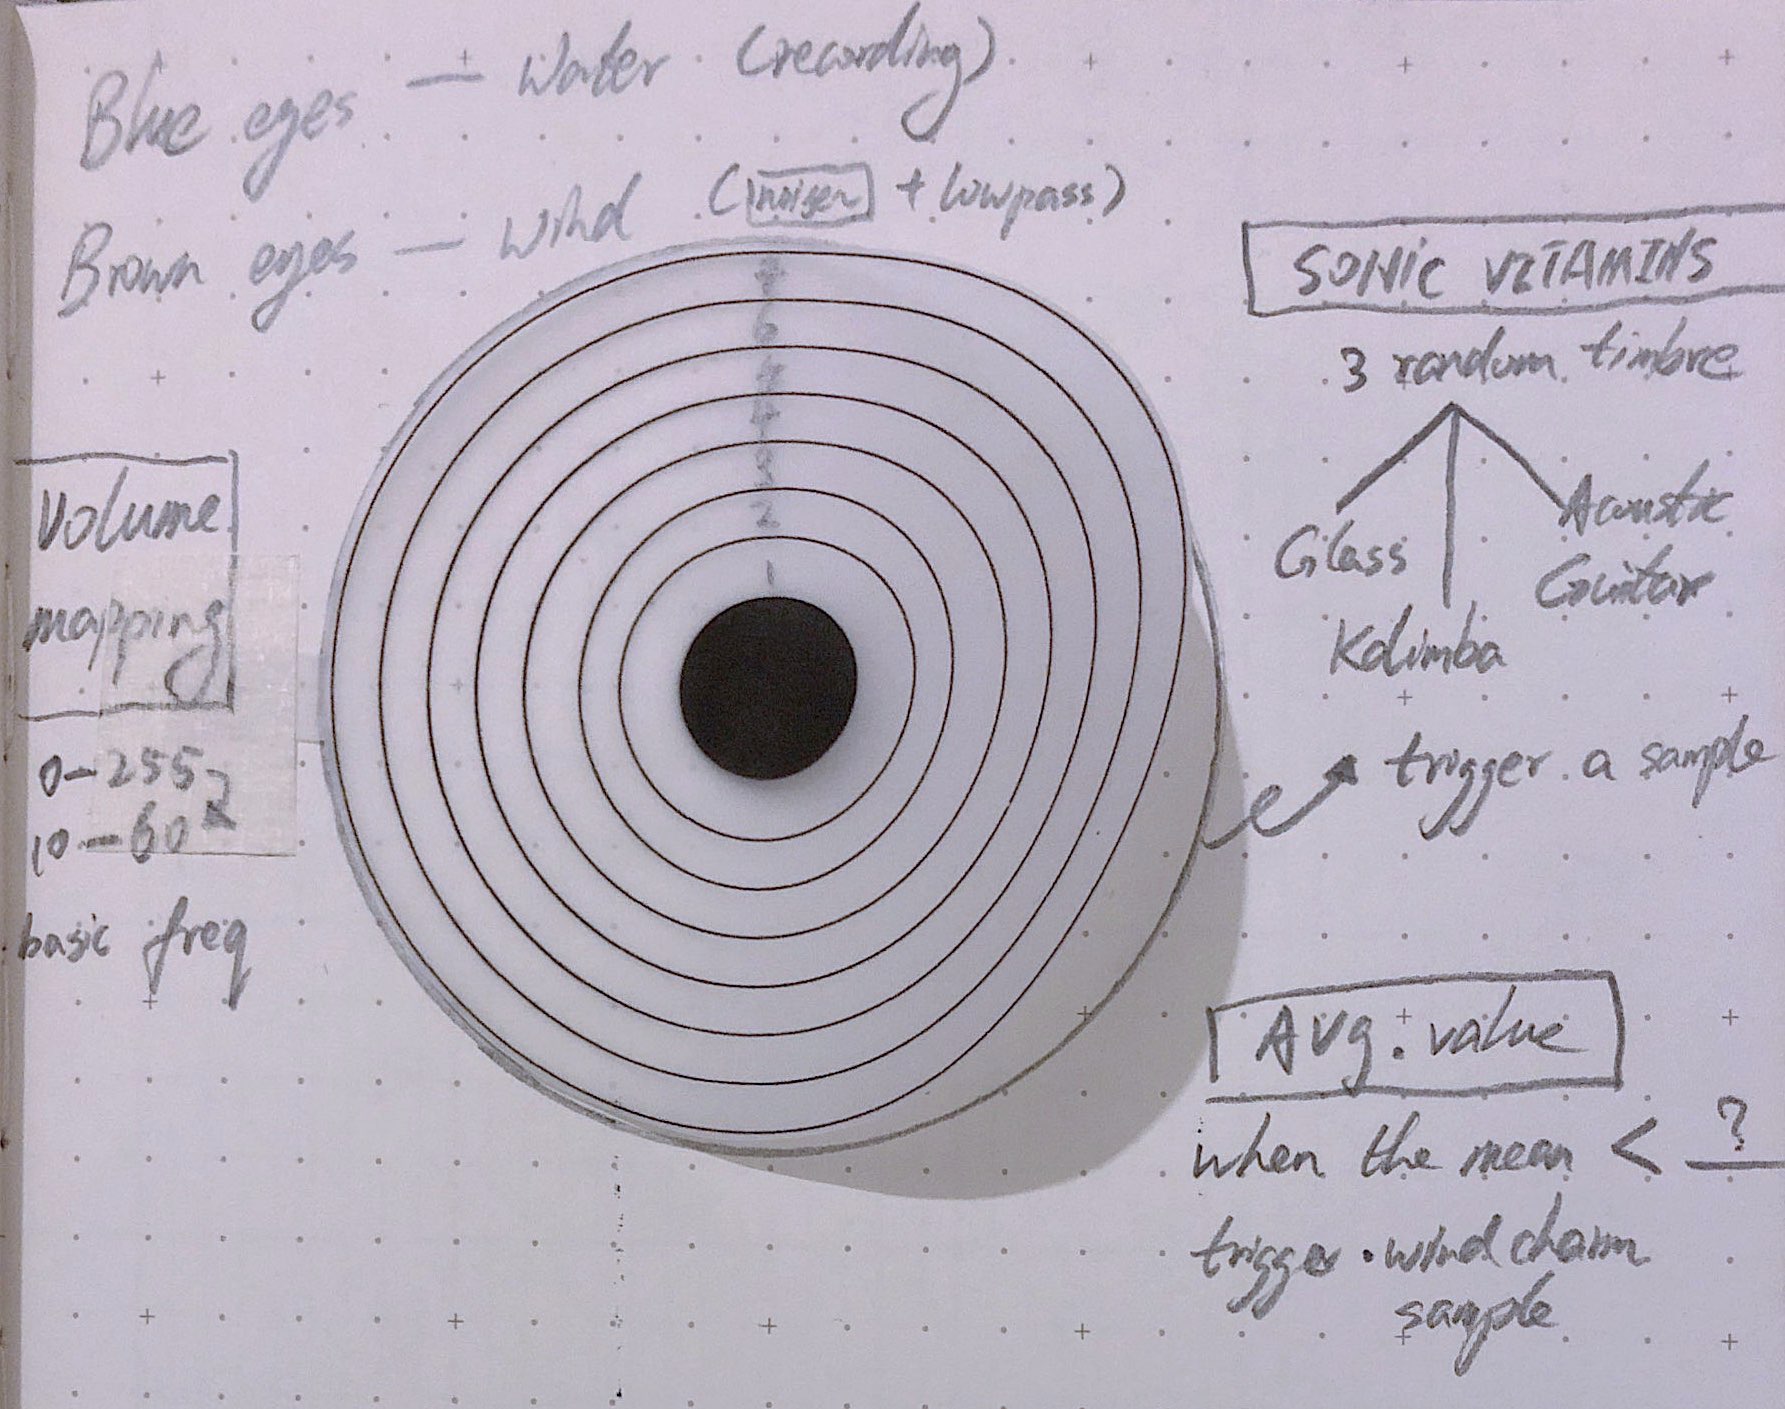
- There are two different background sound will be played non-stop during the treatment to enhance more texture to the whole soundtrack. A blue-eye patient will hear the pre-recorded tidal waves recordings whereas a brown-eye patient will hear a wind-like ambient sound.
- A set of “healing frequencies” is assigned to each zone and the volume is controlled by each pixel values from the 7 zones. The pixel value is mapped from 10 to 60 in order to create a dynamic for the sonic treatment.
- I also calculated the average value of the pixels from 7 zones so it will keep changing over time depending on the iris data. When the value is below 80 (a threshold) and been counted 7 times, a wind chimes recording will be played. I add a recursive delay effect in Max to that so the sound will sustain for a longer time and mimic real-world activities. It will be played once in the sonic treatment to indicate that 1 min has passed.
- There are 3 different timbres in total for sonic vitamins: Kalimba, Acoustic guitar and Glass. The system is going to randomly choose one of them at the very beginning and after 1 min(just want to create more diversity the sonic treatment). Each zone has a corresponding interval to the basic healing frequencies. And those samples will be triggered when the pixel value is below 80.
*from “What is Sound Healing” by Lyz Cooper and the source material from Amor-Sui which I mentioned before.
Making my own “Sonic Vitamins”
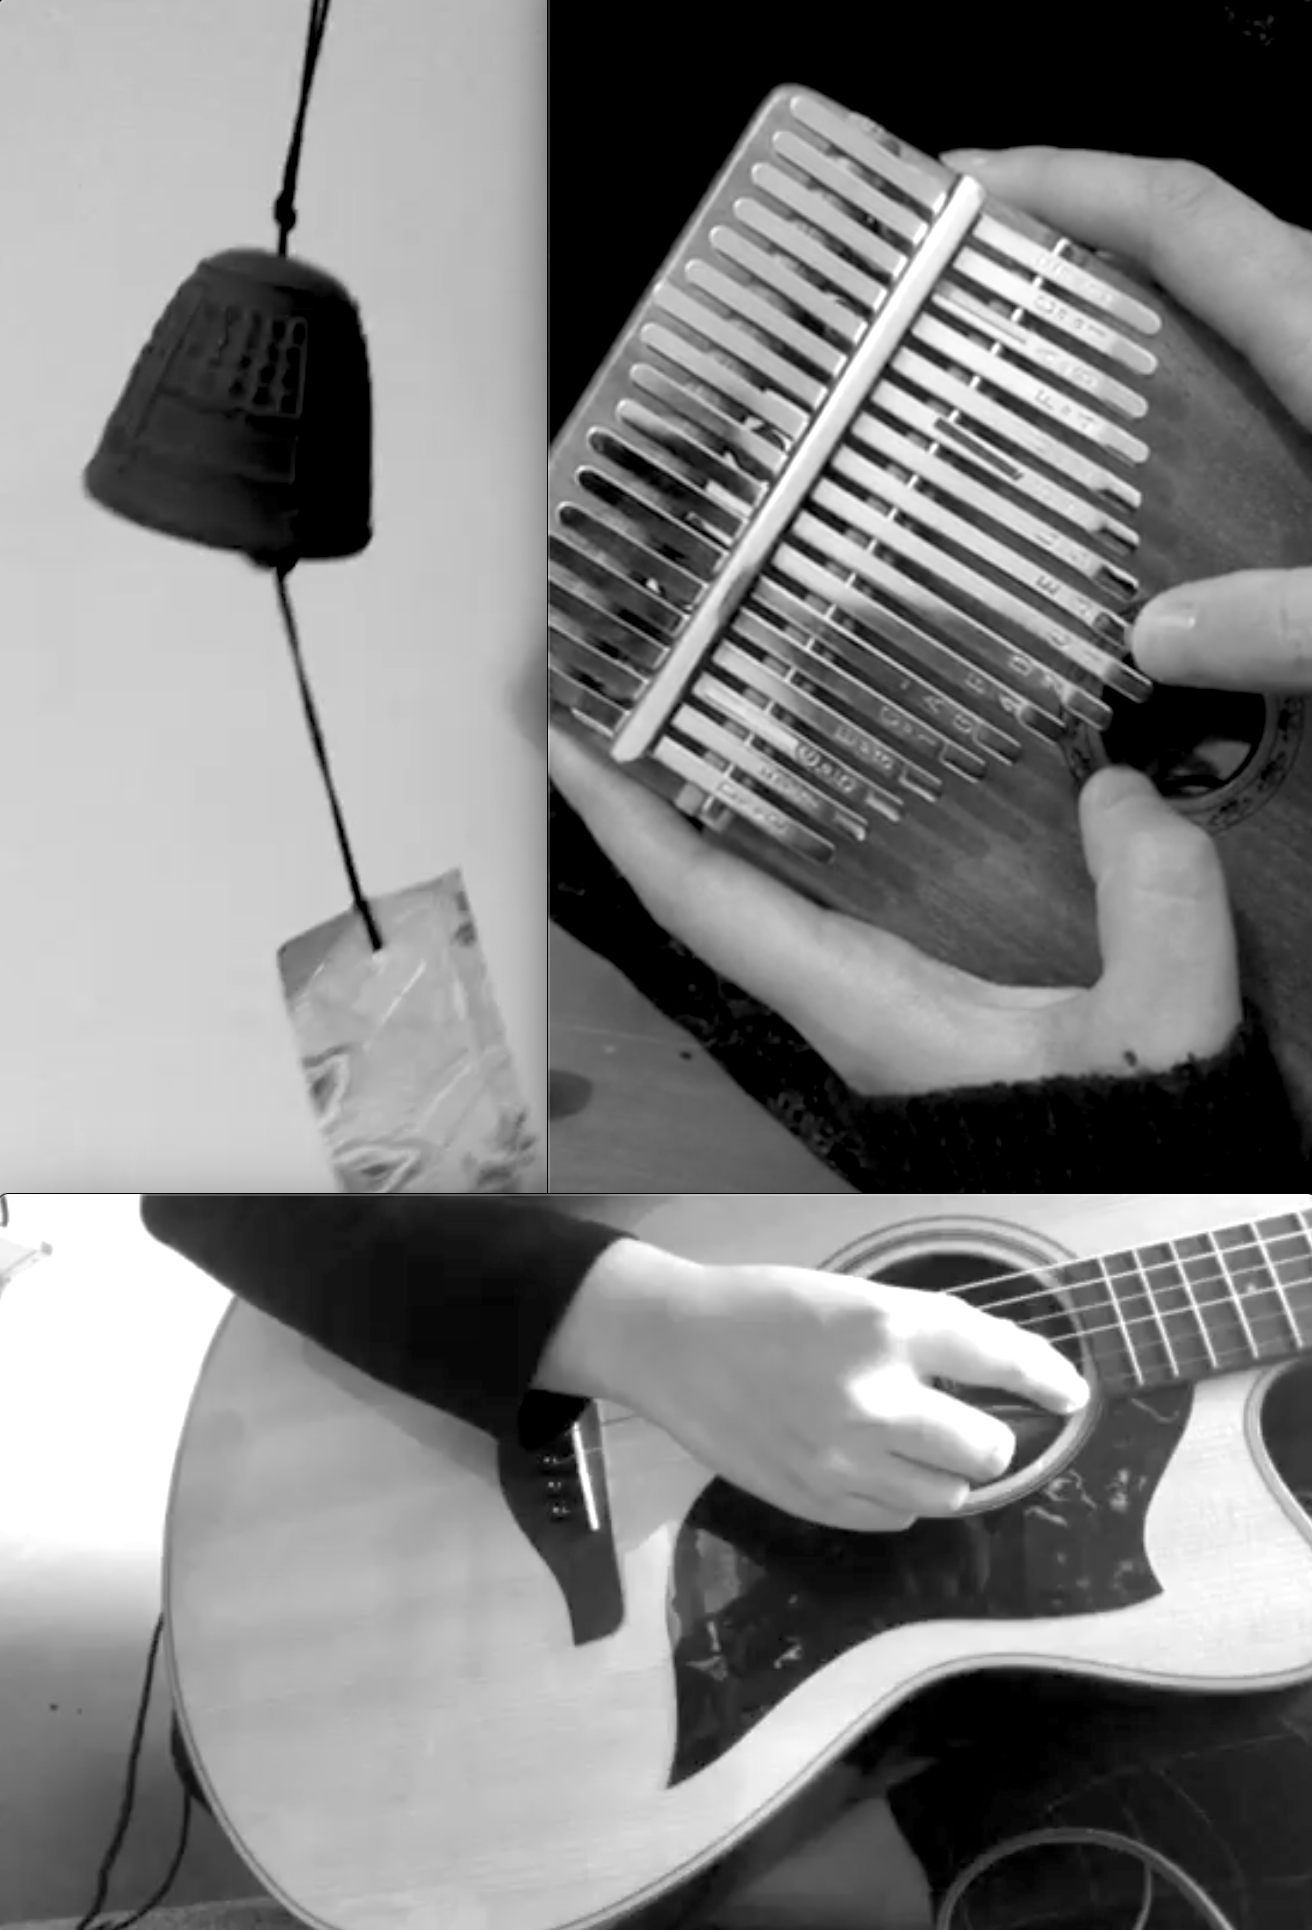
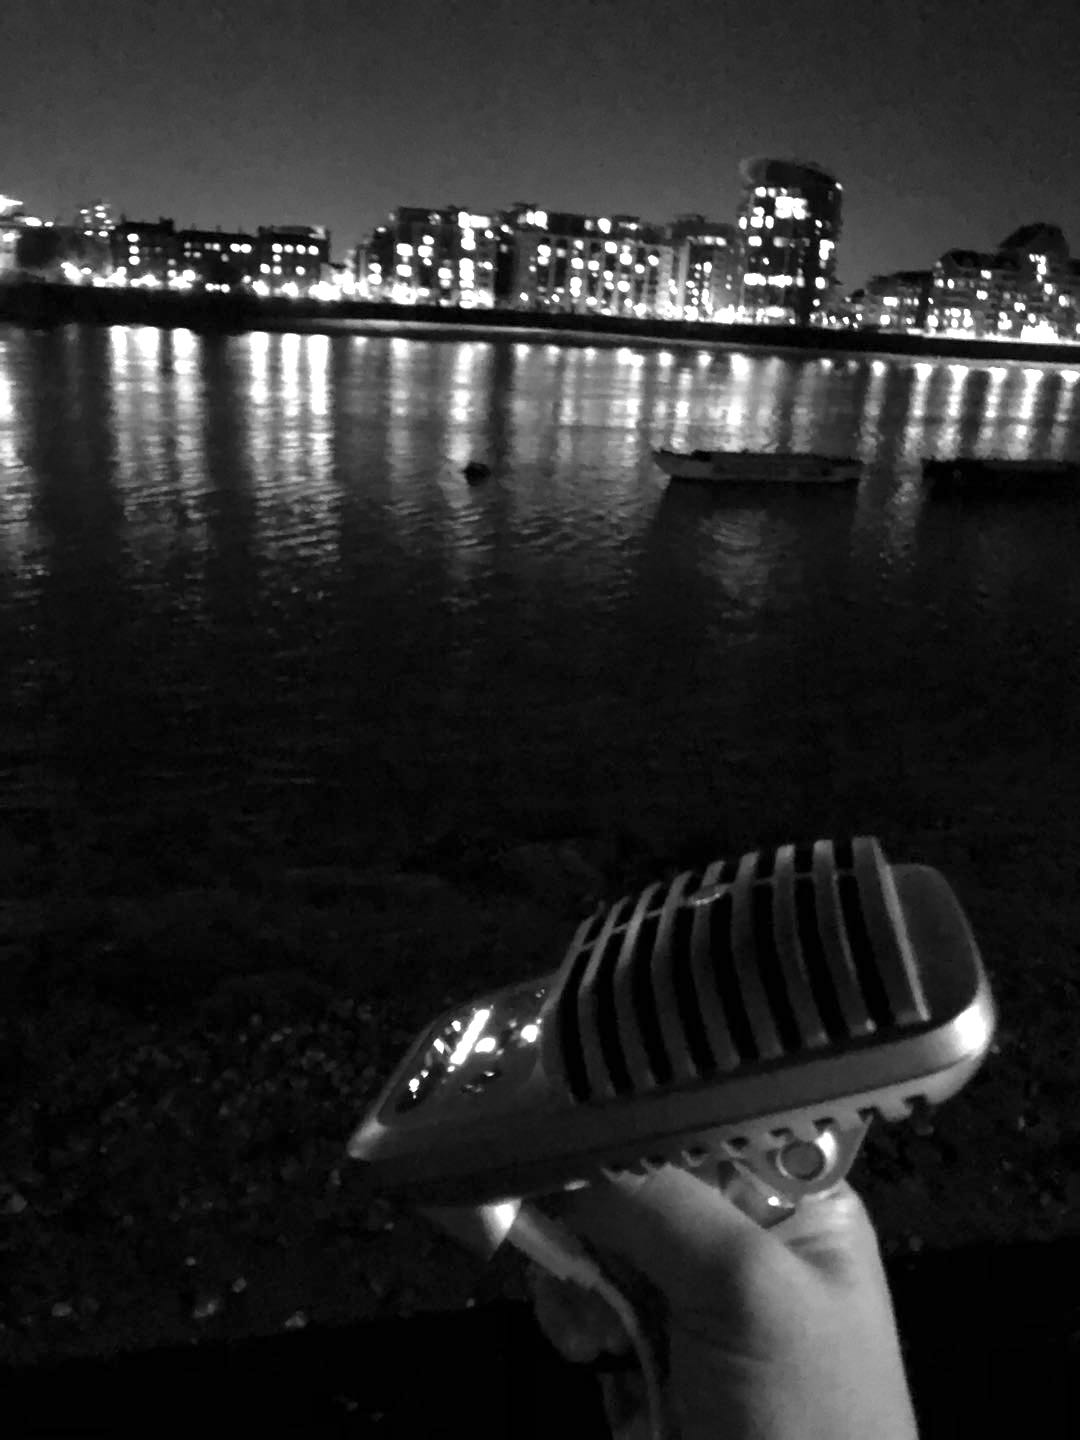
Instead of using purely digitized sound, I recorded the vibration of acoustic guitar with the hand-held EBow(Electronic Bow) as the audio sample. It gives me a rich and clarinet-like tone with a slow-swelling response. The smooth and sustained result is really satisfactory and I use the "harmonic mode" which can produce a higher harmonic sound instead of the fundamental note. Kalimba, also known as an African thumb piano is a unique instrument that I really like. This instrument can be used very effectively in music therapy according to some website. I found the sound of a wind chime(at my friend’s house) is beautiful and it reminds me of the important component of religious rituals. My friend got this from Japan and she said she fell in love with this unique wind chime when she first heard the sound. I chose to play intervals at the same time and use those recordings as one of my “sonic vitamins” timbres eventually.
It should be clearly stated that the recorded samples are slightly edited to match with those specific resonant frequencies. Here are some video clips of making the sonic vitamin: AG, Kalimba, Windchime and tidal waves of the River Thames.
Visual representation
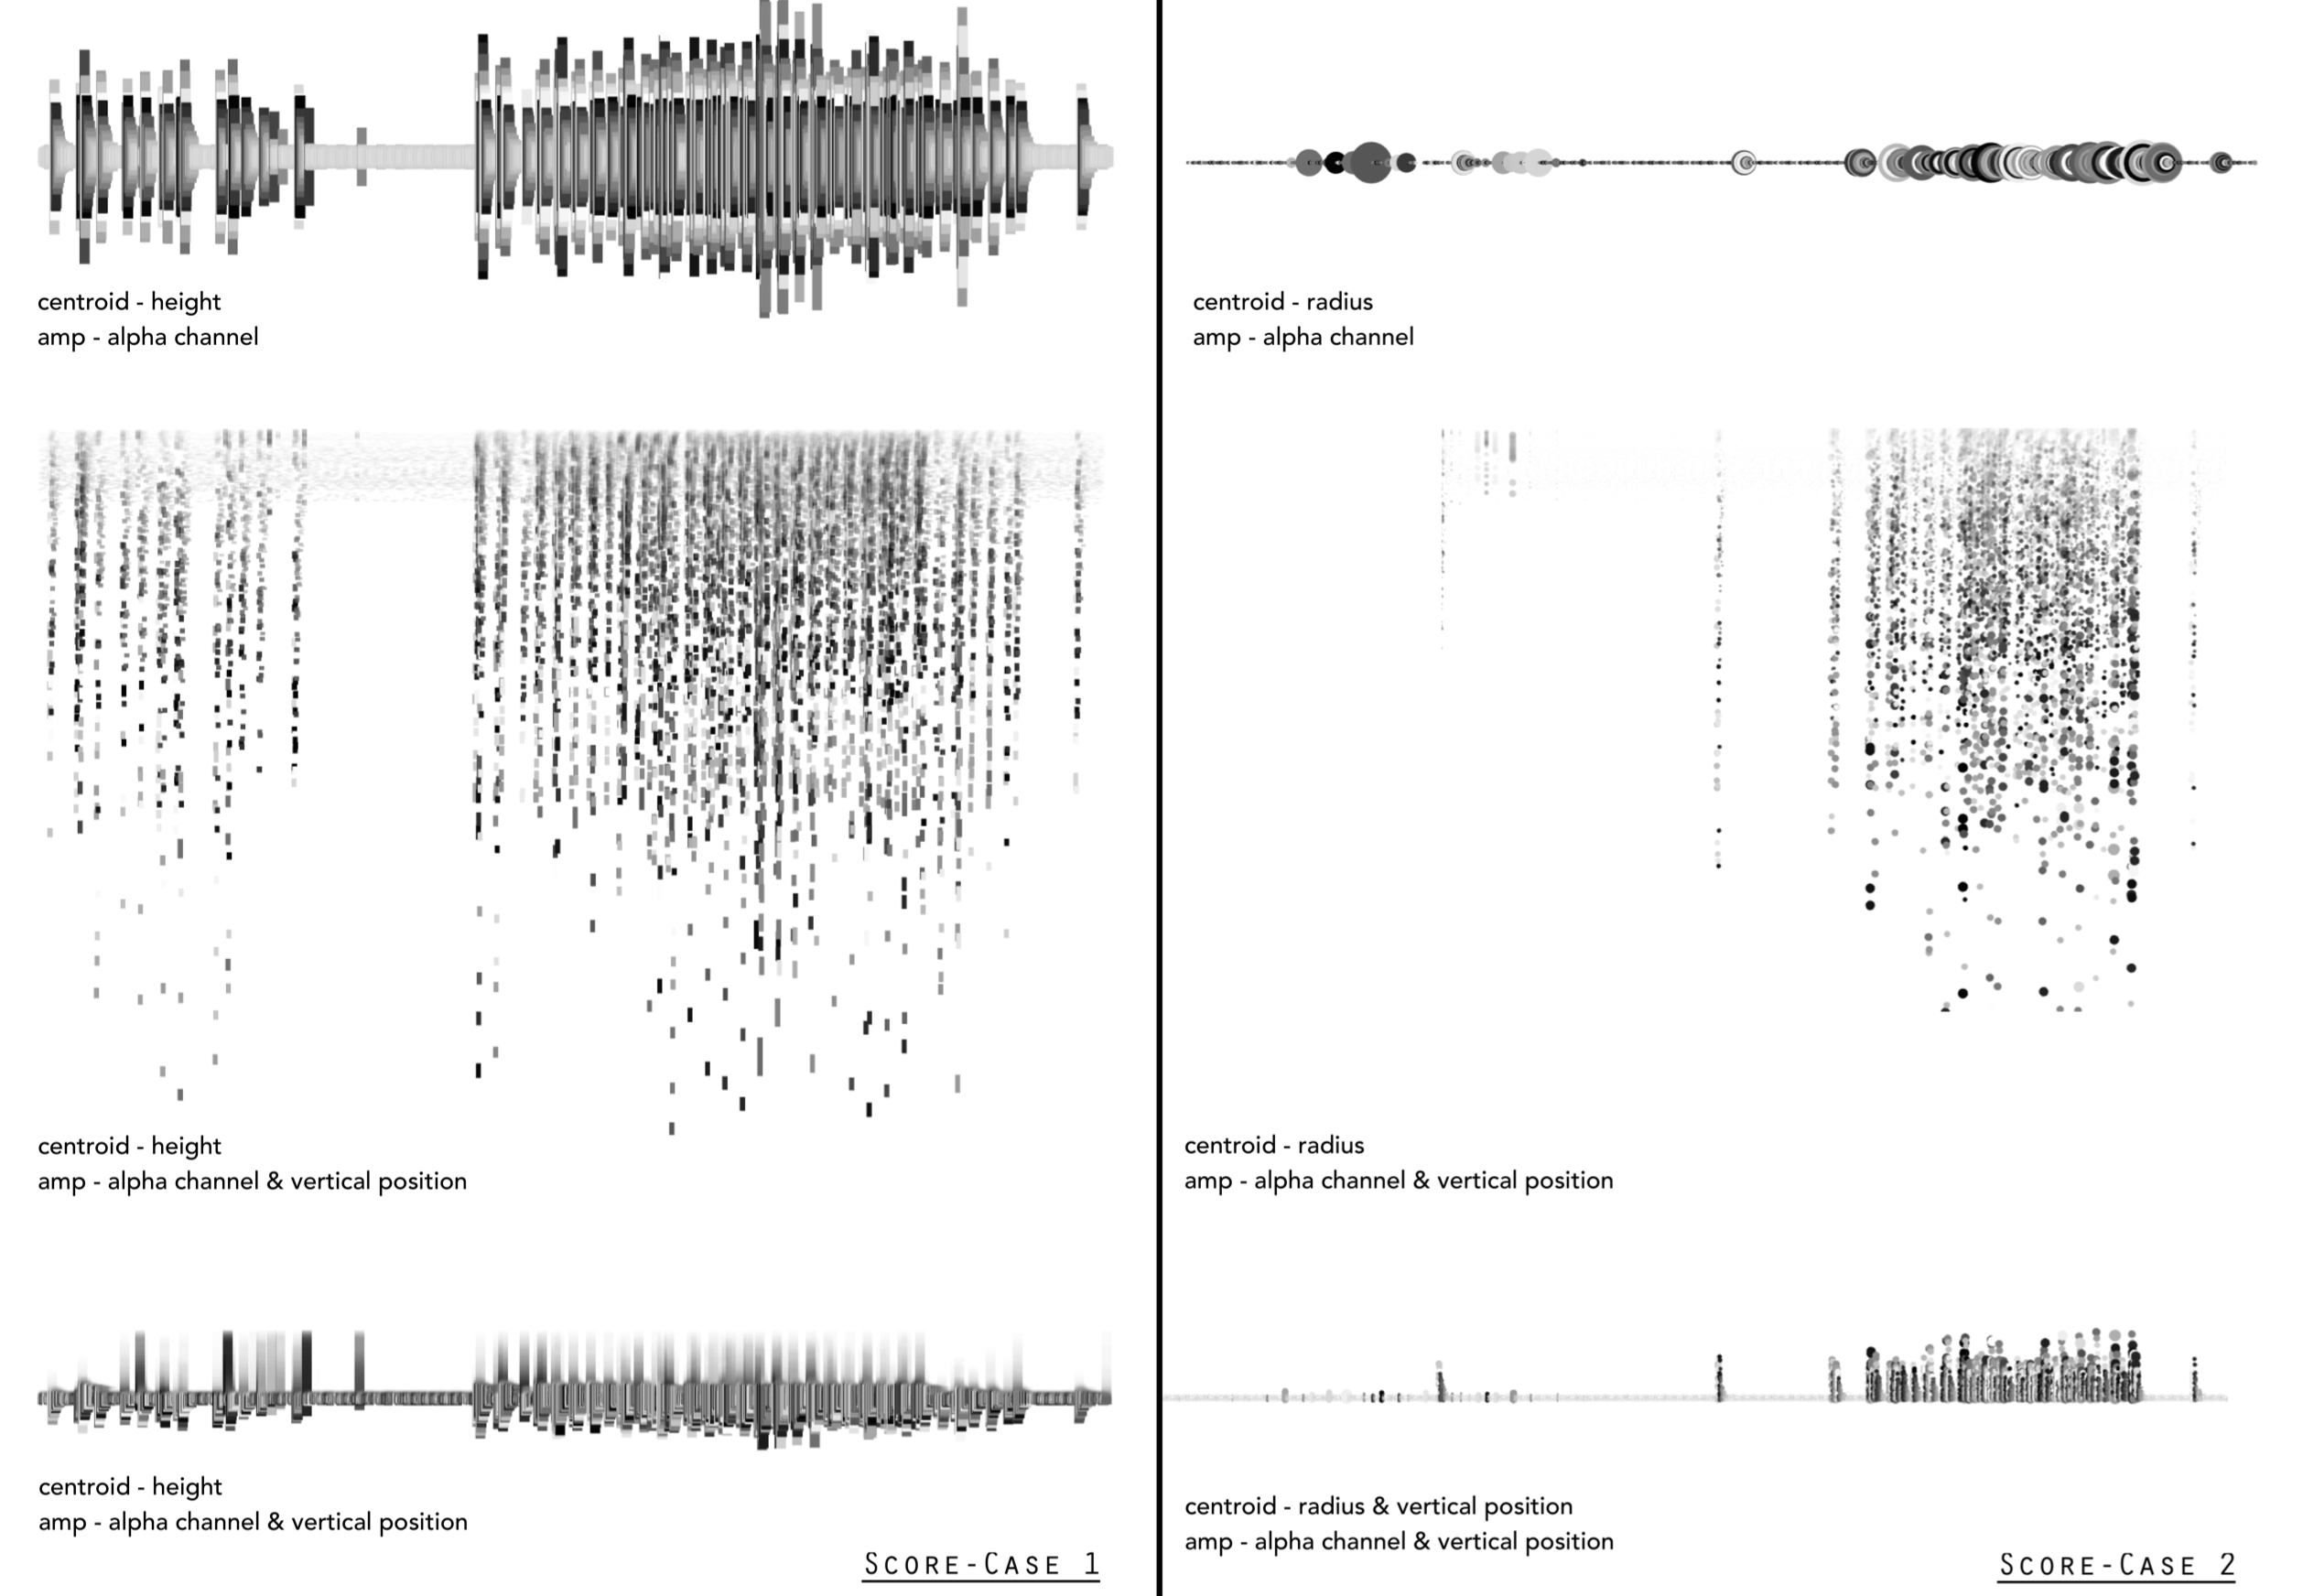
With “COSMOS”, there is just an actual iris image with a scanning line projected on a surface for people to see the real-time sonification process. I then chose some of the iris images and sound (with permission of the participants) and visualized the sound file into other formats like spectrogram, which displayed the frequency distribution information with time (see the 1st pic below). Later, I made the attempt to notate the audio in a linear row to determine the time. In a graphic score, the sound is often represented through non-traditional symbols or images, so I adopted two different shapes: the rectangle and the circle(see the 2nd pic below). As for sound visualization, this approach is going to be a great and easy way to bring less confusion to the viewers.
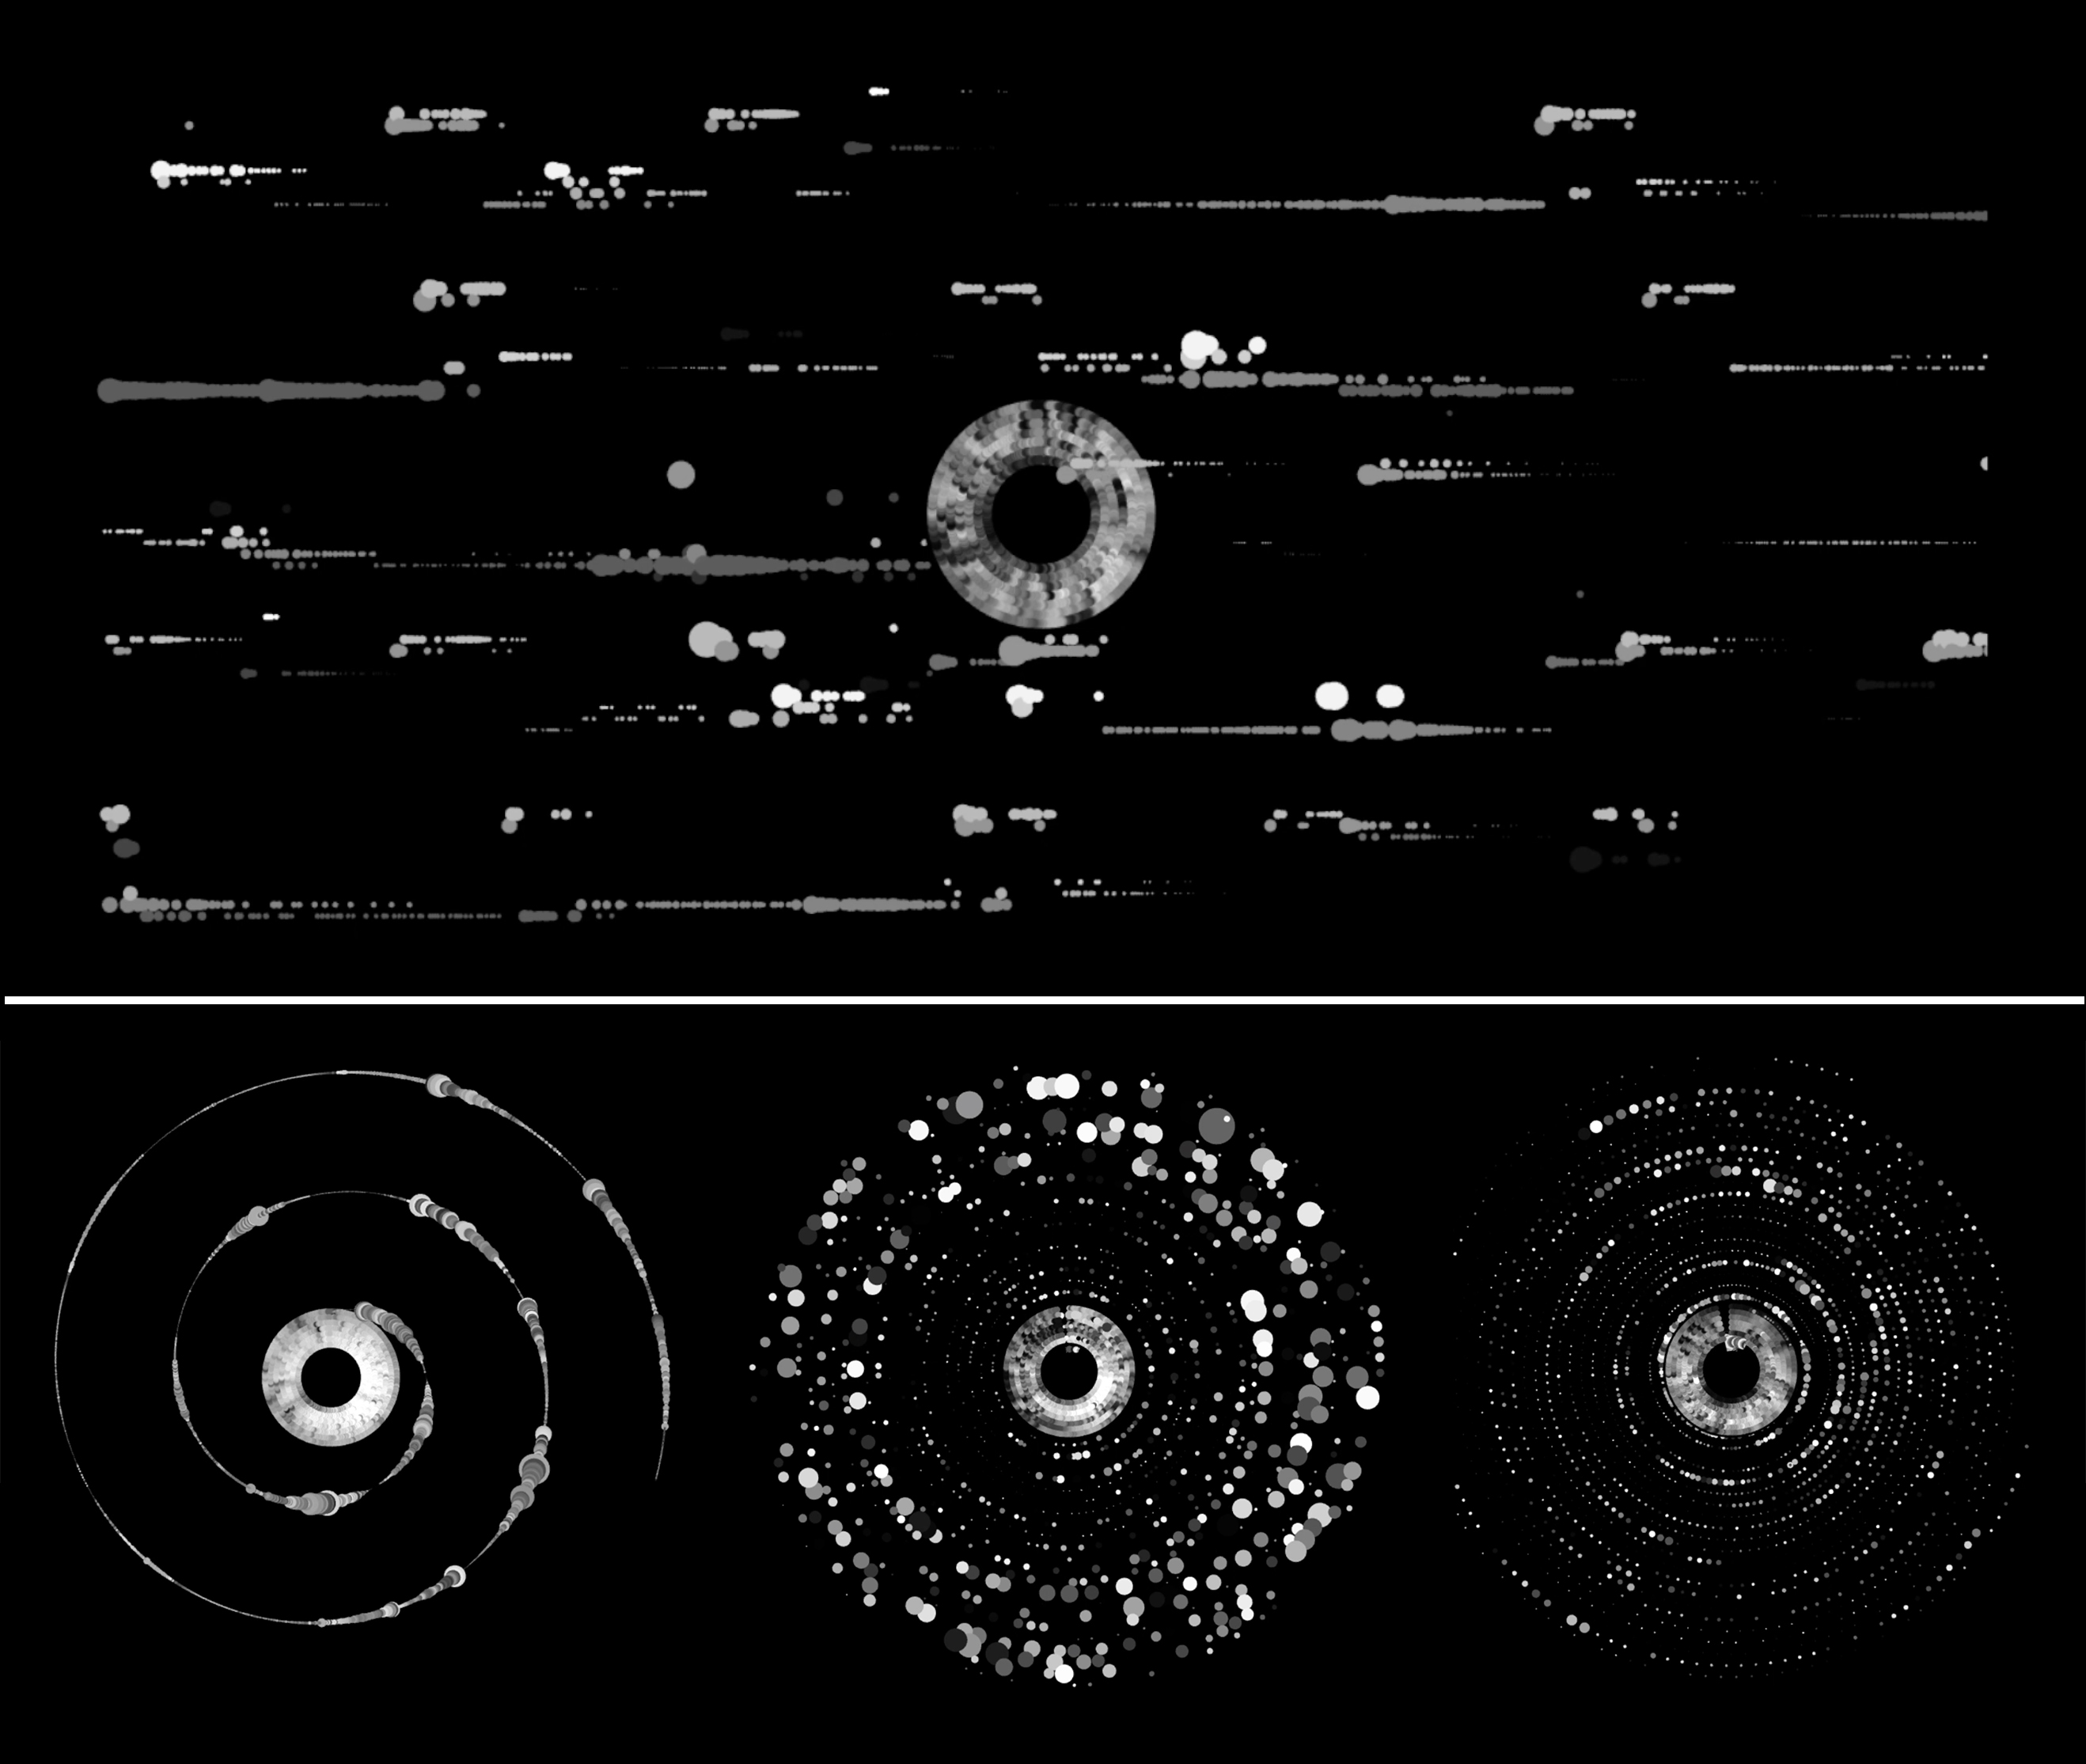
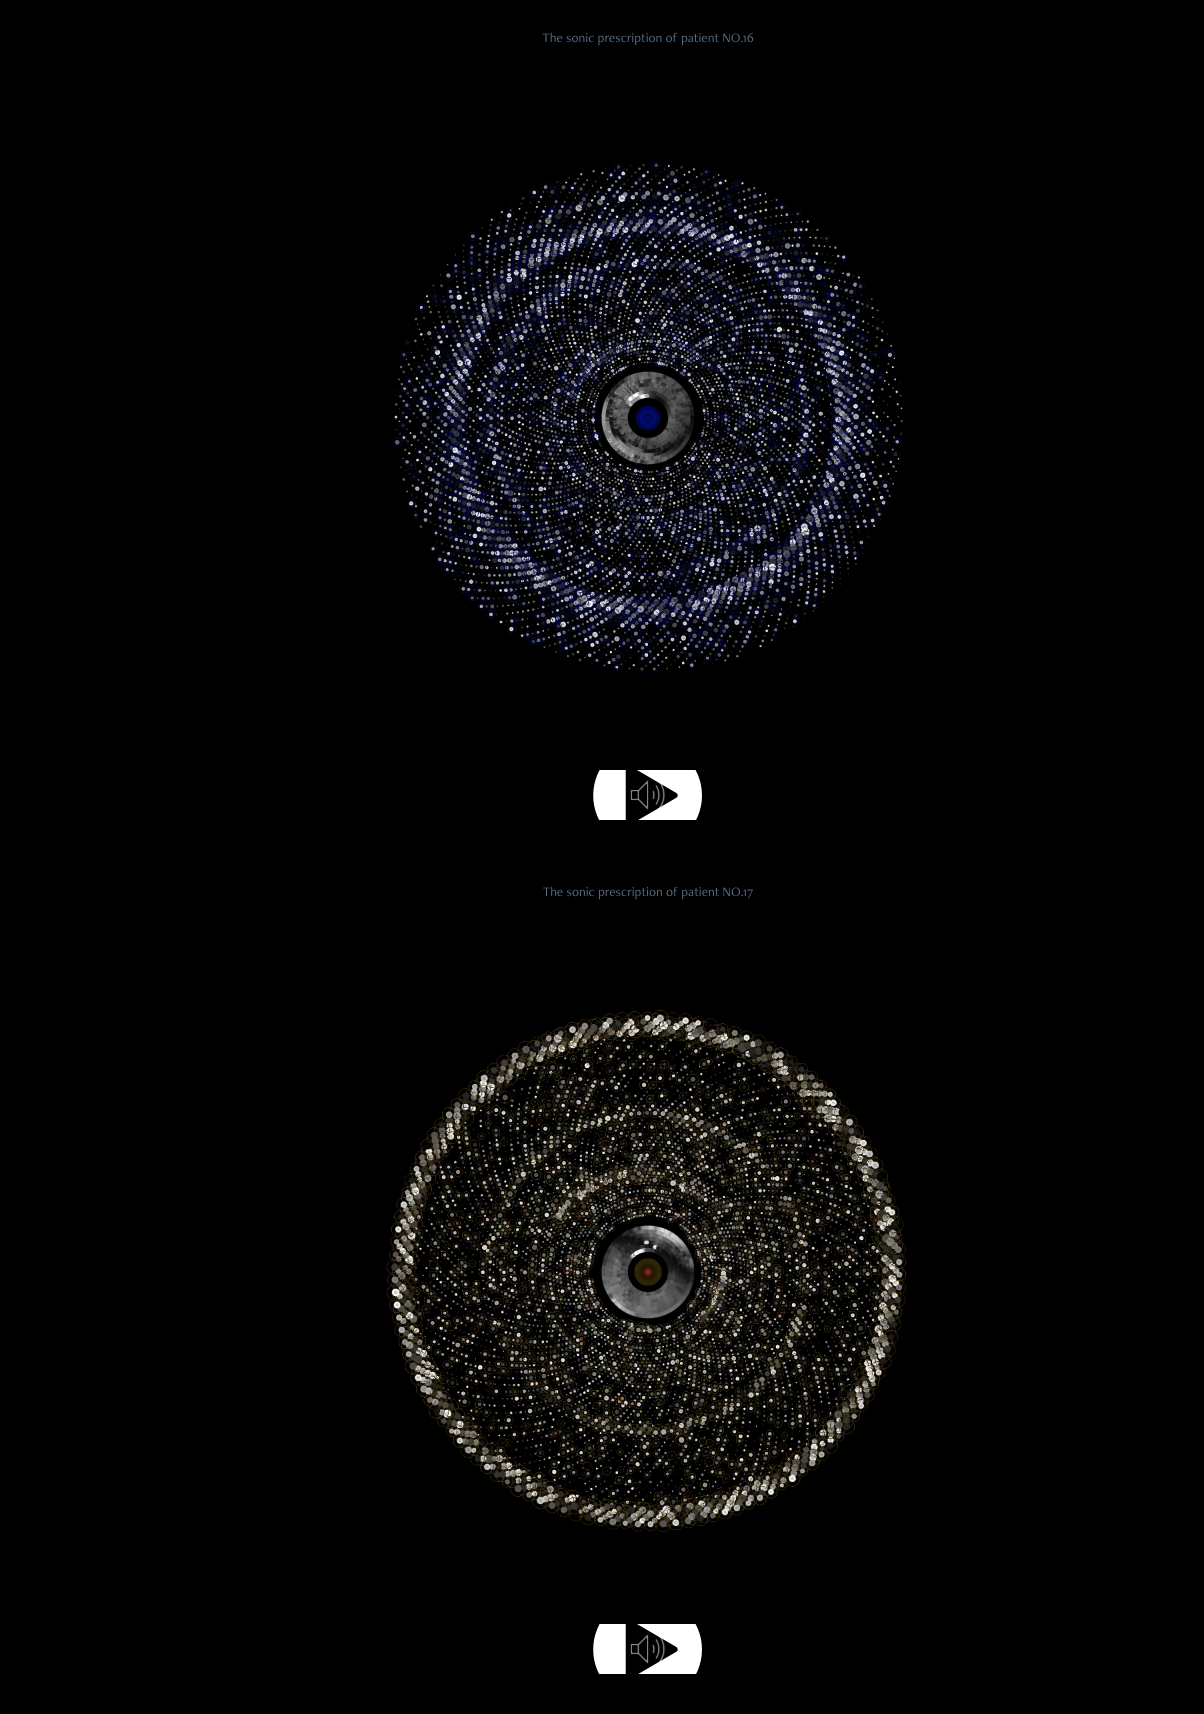
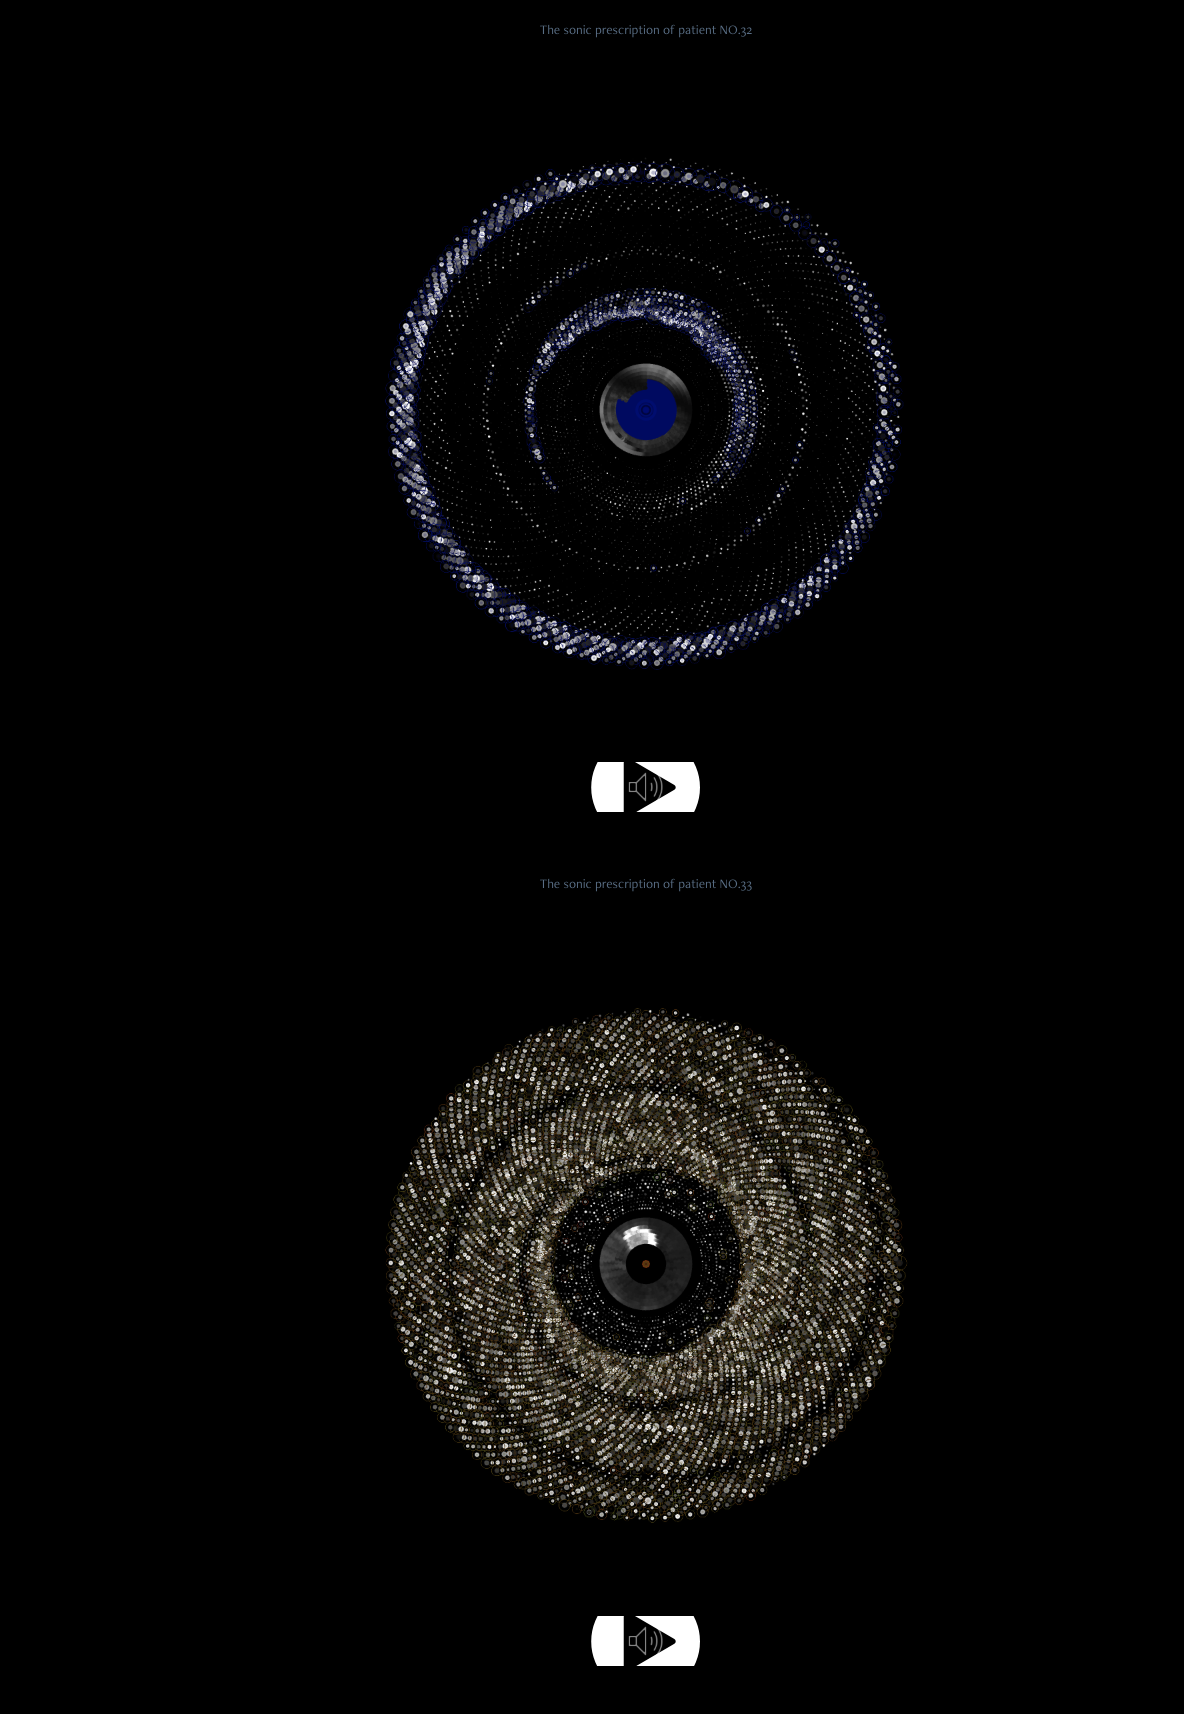
In the earlier June 2019, I had a work-in-process popup exhibition for two days and I showed several visual experiments (see the 3rd pic below). The scores in a radiation pattern make people associate with eyes more. Therefore, I decided to use this visual form and make small steps forward by adding colour to that. The bluish iris will generate visual with blue colour whereas brownish iris will generate visuals with brown/orange colour. I mainly use three parameters from audio analysis to draw the shapes with Maximilian library in OF: the amplitudes, the spectral centroid and the peak frequency of the signal.
- the amplitudes are controlling the transparency of a single dot;
- the spectral centroid is mapped to a certain range of the radius (from 0 to 20) and also the colour of each dot;
- when the centroid freq is higher than a threshold value, draw different visuals in colour;
- the peak frequency only controls the radius of a pupil(a centre dots)
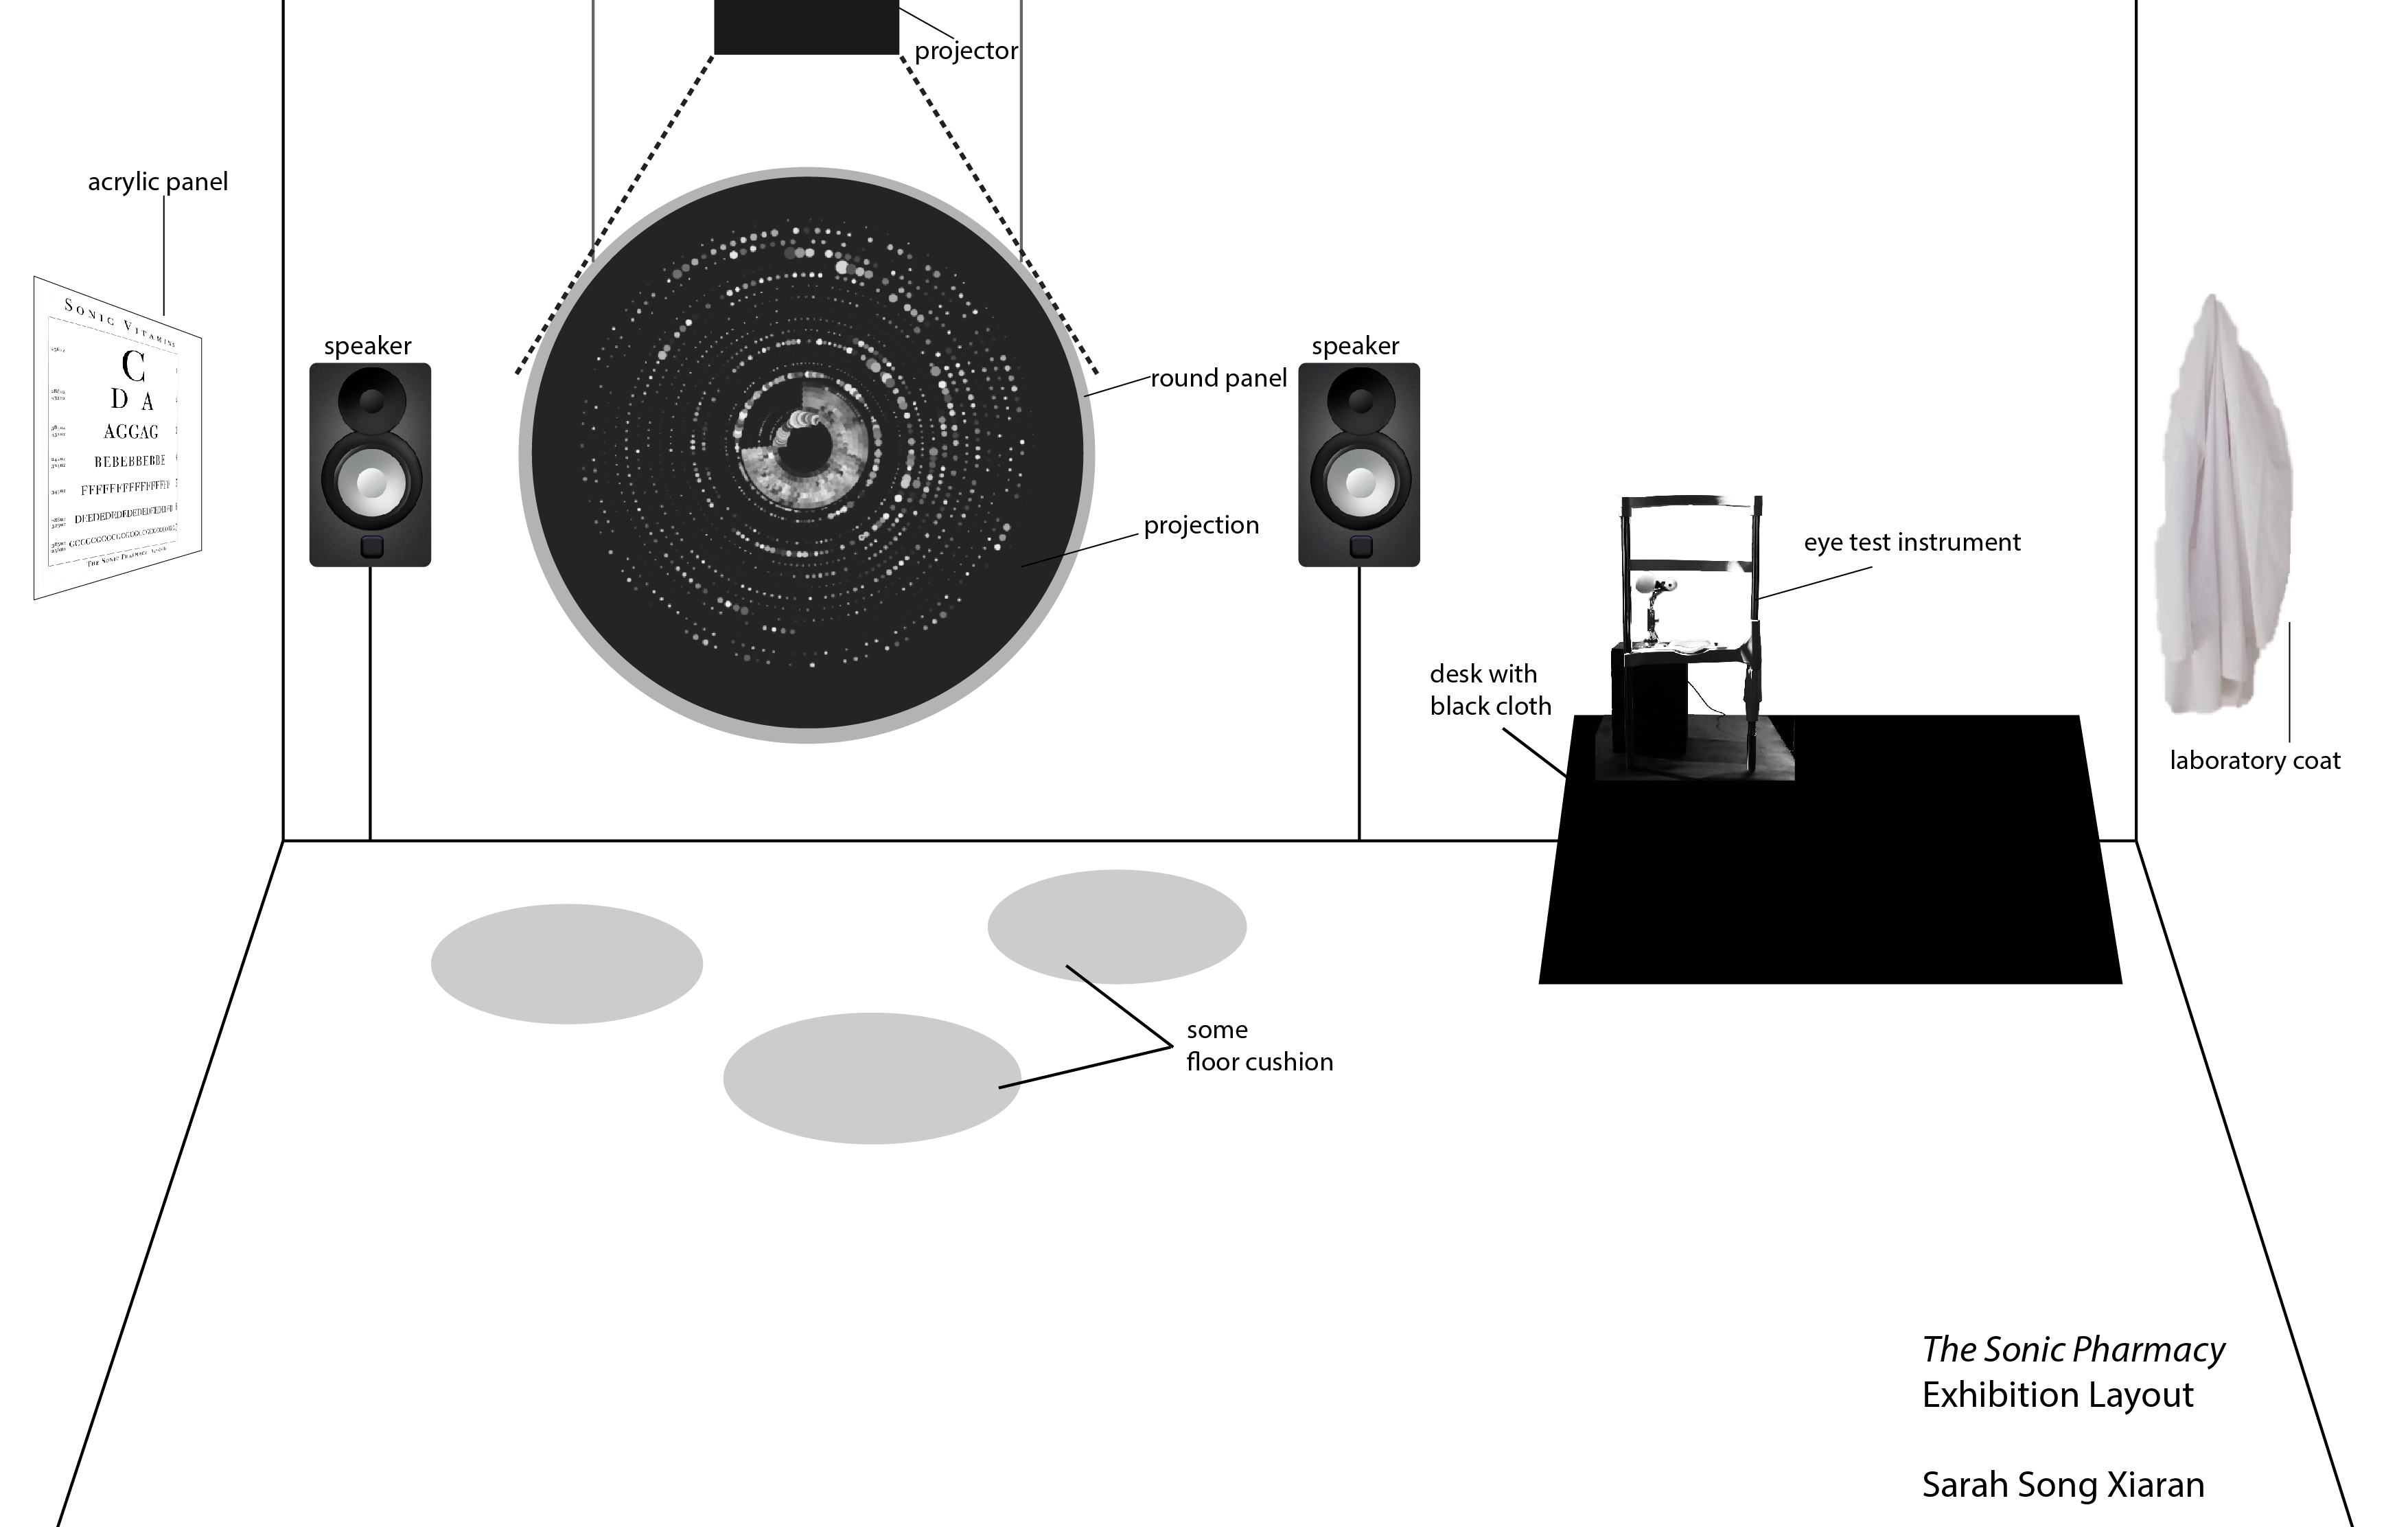
Exhibition floor plan
In order to make a clinic-like setting, I want to have a table set for the eye test support stand. There is going to be some acrylic engraved LED panels for information display because that material gives me a sense of futuristic. I will have stereo speakers set up in a small room, so I will turn each speaker inwards until they beamed sound directly at the audience. There is an "eye-test" area and also a "sonic treatment" area.
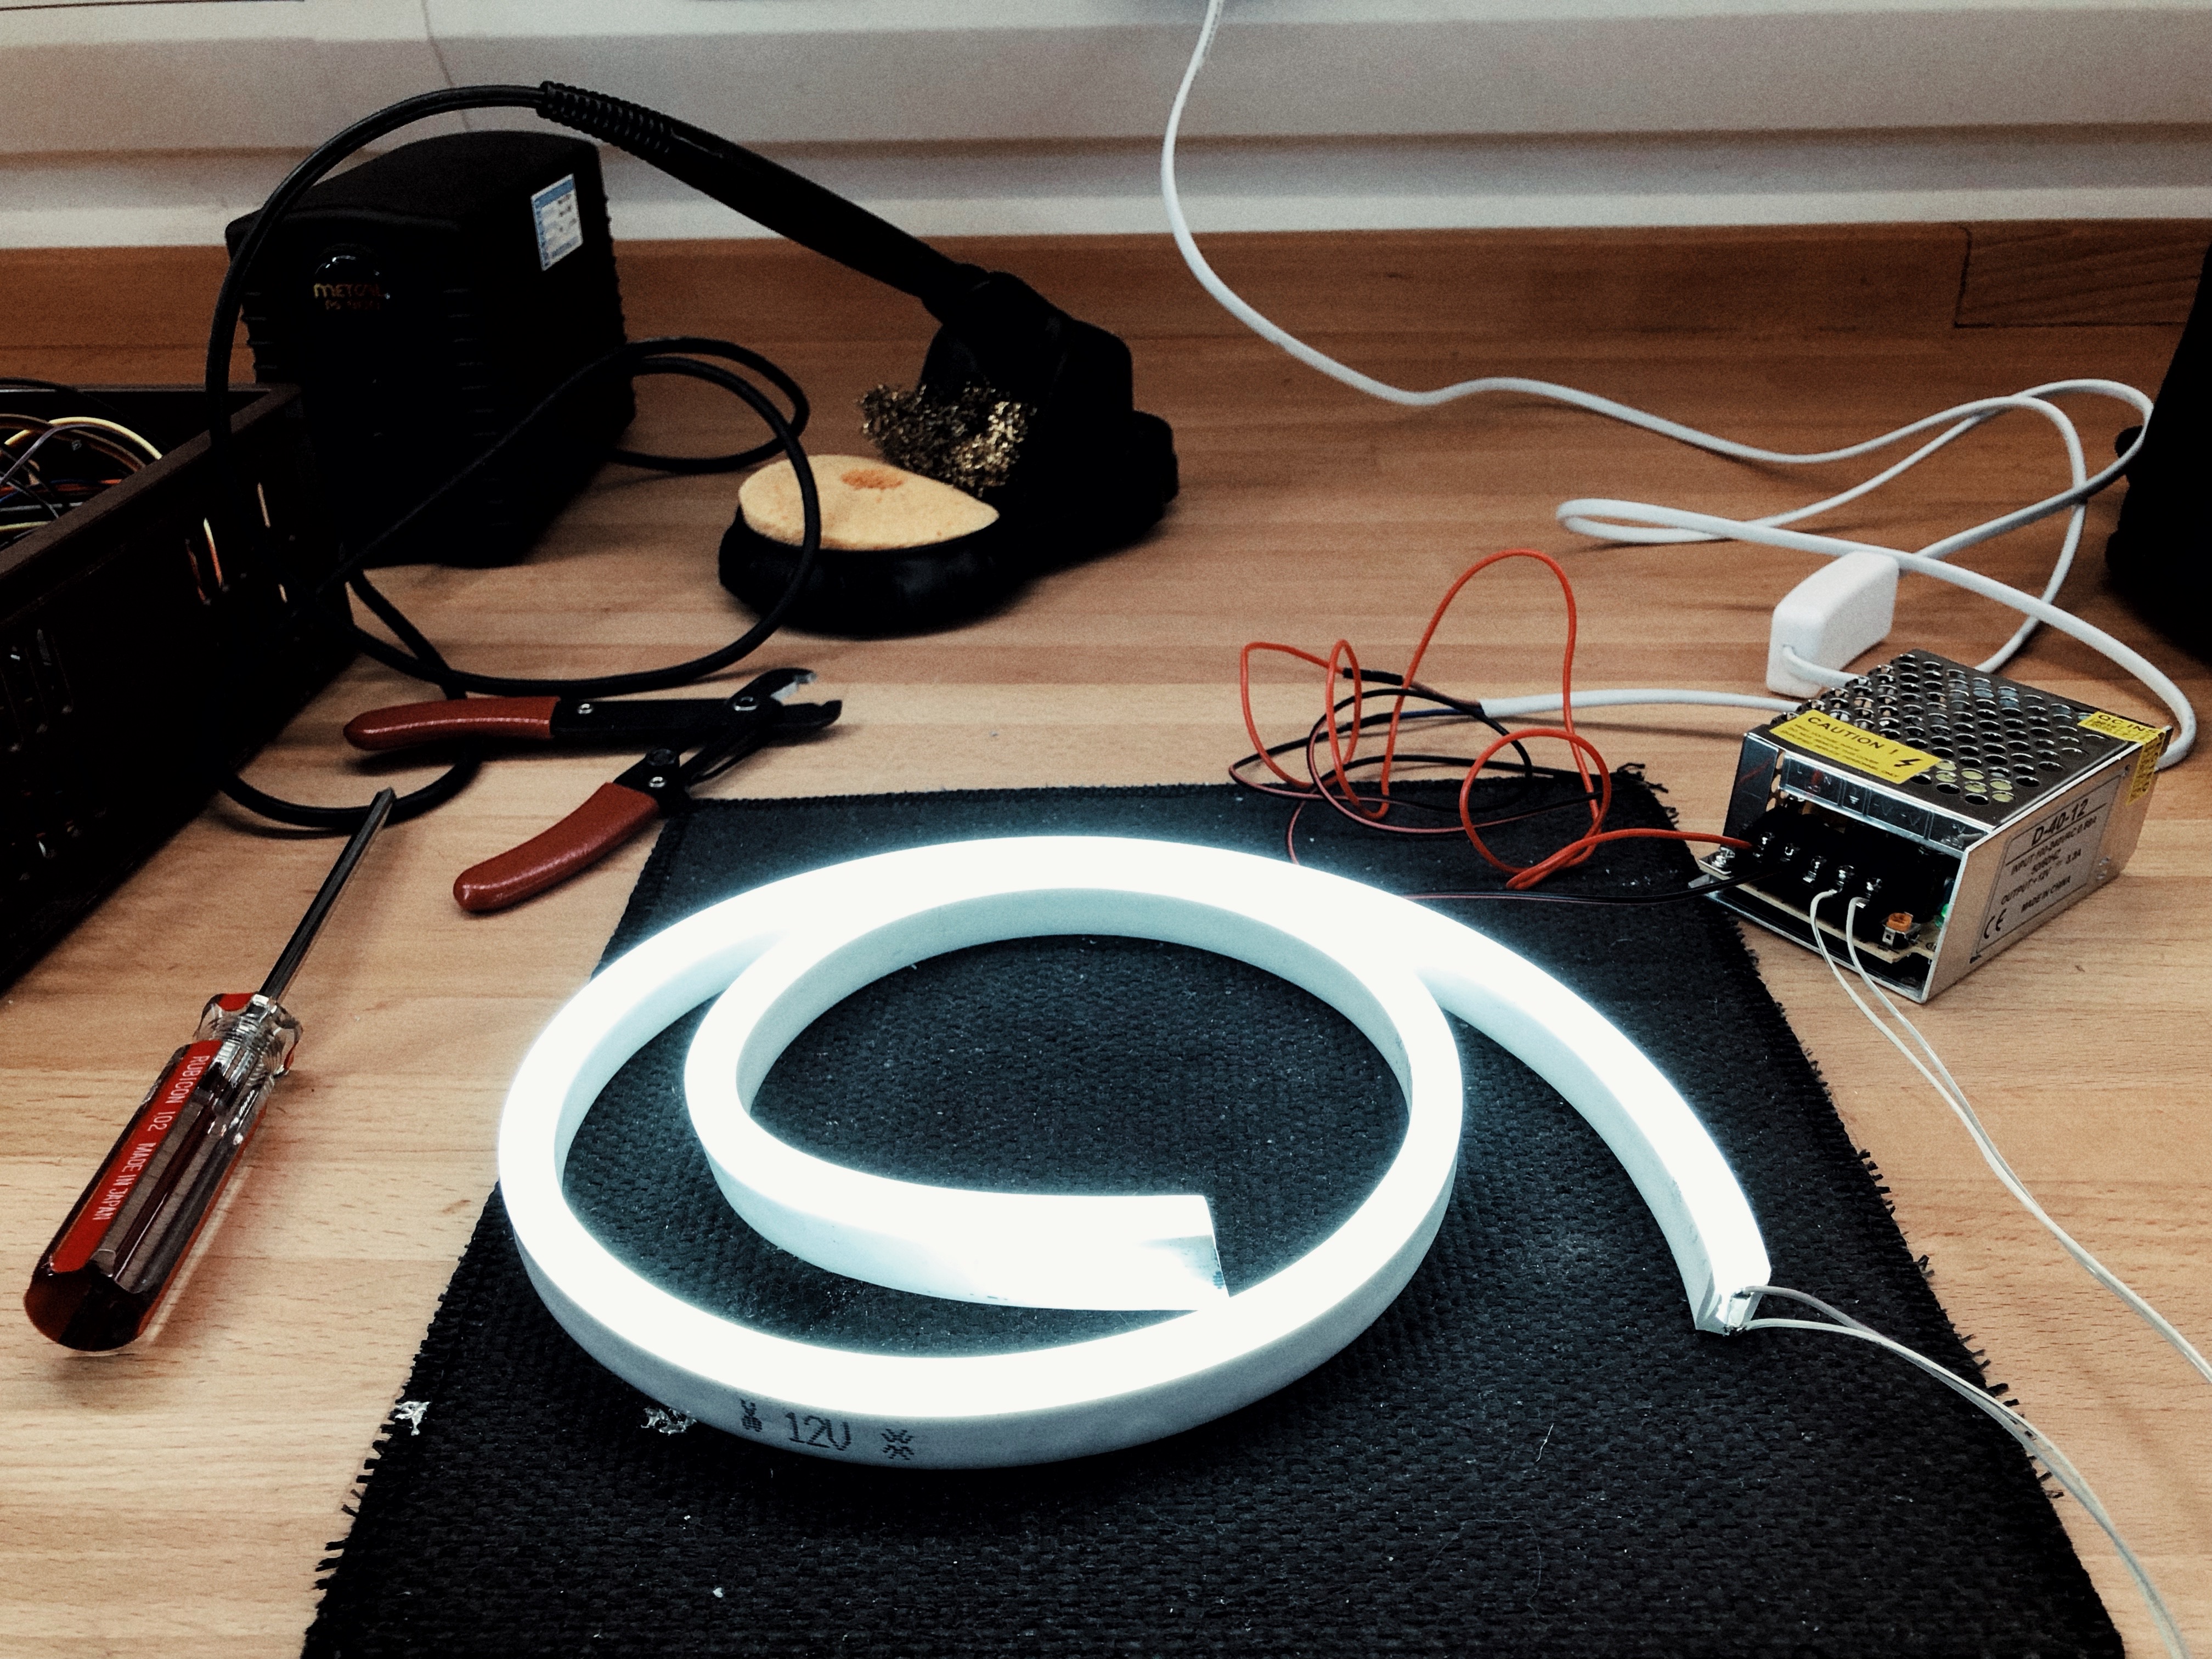
behind the scenes:
Here're some footage of me and Pete setting up the whole installation and some preparing footage.
Future development
- I would like to know what effect it will have if a fully automatic installation with instructions for the participants is developed. What if the iris analysis and sonification process are done with a mobile application?
- There is still plenty of work on an in-depth analysis with biometric data such as irises. The next necessary step would be to get in touch with a real sound therapist and iridologist in order to cultivate my knowledge in iridology and sound healing in the near future.
- Maybe I can modify the form and present this project as a live performance.
- What if compose a new piece of soundtrack based on all the data(with permissions) I've been collected during the exhibition?
A website for online sonic prescription:
I've created a website where I will put all the final images and audio online and the "patients" can get their sonic prescription online and listen to that again and again with a specific identification number. (Some results are been deleted and not uploaded since they are still a very personal data to some people although the visual images contain only a downsampled pixelated iris picture).
Self-evaluation
I was surely very excited about how The Sonic Pharmacy turned out overall. The early version, COSMOS, received some positive feedback from the audience, and this year, I've got plenty of comments saying that this piece has been developed from the previous one according to people who know/experienced COSMOS before. I'm really happy to hear that and complete my sonification system and bringing sound healing idea to the public. Without a doubt, the sonification of the biometric data is the most challenging part of this project. It is hoped that listeners (participants) can learn something new about the data by listening to the sound of their irises. I have learned a lot from this project.
Non-clinical healing is an interesting area to explore by both artists and scientists. Just as Randall McClellan states that “the power of music as a healing force is that through it we may re-experience the fluidity of the world in which we live” (McClellan, 2000. p188). I think that we should welcome the unexpected surprises in order to discover new knowledge. Bioart does provide us a new perception and aspect to know ourselves better, but at the same time, Bioart artists need to be aware of some ethical and safety concerns, such as the privacy of the audiences’ biological data. As a student majoring in computational arts, I take challenges as opportunities. “New concepts emerge for Bioart in physical, digital, and computational forms” (Yetisen et al., 2015). I am sure that more and more artists will be inspired by the evolution of biotechnology and synthetic biology.
References
- Jensen, B. (1982). Iridology: The science and practice in the healing arts (Vol. 2). Escondido, CA: Author.
- Jensen, B. (2011). Iridology simplified. Summertown, TN: Healthy Living Publications.
- Endeavour College of Natural Health. (2019). Clinical Skills 2: Naturopathic Medicine Department. [online] Available at: https://source.endeavourlearninggroup.com.au/coursematerial/pdf/Documents/HMCL312_SN02_Lecture.pdf [Accessed 19 Jun. 2019].
- Goldman, J. (1992). Healing sounds: The power of harmonics. Rockport, MA: Element, Inc.
- McClellan, R. (2000). The healing forces of music. San Jose, Calif.: ToExcel.
- Pramerdorfer, C. (2011). An Introduction to Processing and Music Visualization.
- Goddyn, H. (2013). The Human Mandalas. [medical imagery]
- Bergstrom-Nielsen, C. (1993). Graphic Notation as a Tool in Describing and Analyzing Music Therapy Improvisations. Music Therapy, 12(1), pp.40-58.
- Yetisen, A., Davis, J., Coskun, A., Church, G. and Yun, S. (2015). Bioart. Trends in Biotechnology, 33(12), pp.724-734.
Acknowledgements
Written in OF version 0.10.1_osx with addon ofxOsc and ofxMaxim platform Xcode 10.3
Michael Norris Drone audio plug-in: Soundmagic Spectral
Some code is adapted from Theo Papatheodorou:
- pixelAccess - From week 6 of Workshops in Creative Coding Term 2
- oscSend - From week 18 of Workshops in Creative Coding Term 2
Special thanks to:
- Pete Mackenzie
- Rupert Earl
- Conrad Magan
- Julia Makivic
- Richard Moores