


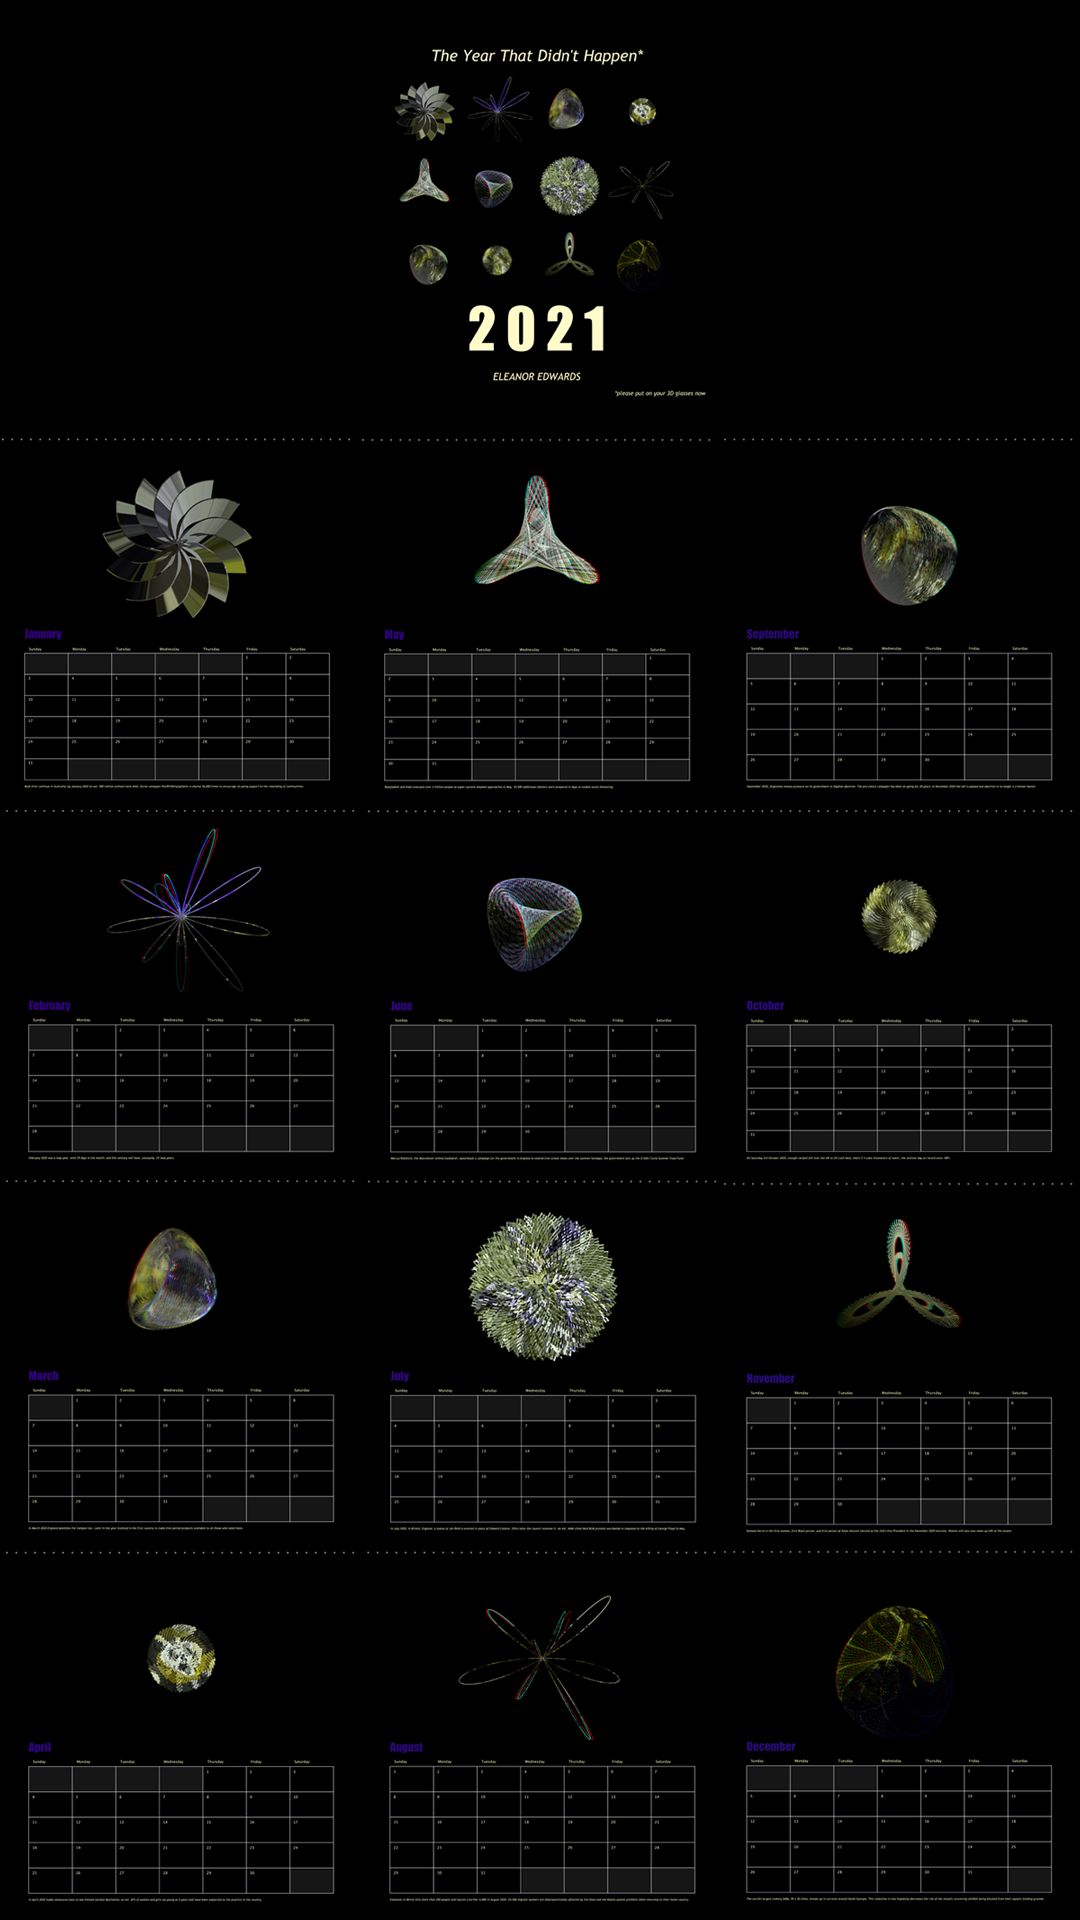
The Year That Didn't Happen
‘The Year That Didn’t Happen’ is a calendar reflecting by social commentary of the world in 2020. As 2020 drew to an end, many had been associating the end of the year with the “end of coronavirus” but as 2021 begins, that end has seemed to move further away.
produced by: Eleanor Edwards
Concept and background research
Reflecting on the 2020 experience, from various perspectives including my own, those of friends and family, and media exposure, I have been able to summarise some of these mindsets that have in some way been impacted by the pandemic. This piece tells a few of the stories at risk of being forgotten amongst the constant stream of Covid-19 headlines.
Opinions that jumped out to me were; a strong urge to forget 2020, long lists of activities, opportunities and events people felt they missed out on, new, different, sometimes good, sometimes bad experiences, the impact on ways and amount of use of social media, the need to hide, the transformation of personal interactions and how they are regarded, the sudden forbidden nature of certain everyday things and the rapid move to prolonged social engagement on a variety of 2.5D platforms.
In accumulating these points, I saw a variety of positives and negatives that ‘forgetting 2020’ wouldn’t represent. A look back over my own year, highlighted how much had happened even if a lot of things hadn’t happened.
Conscious to represent not just my own personal year and with a nod to COVID-19 news fatigue, I have examined other 2020 events. This was an explorative research process, looking at web sources, such as BBC, The Guardian, YouTube and The Met Office along with where those sources took me as well as what others remember from the year. The result was a list of events and related statistics representing each month of 2020 and ready to influence the forms assigned to each month in the 2021 calendar.
My personal guidelines for my selection process:
• A positive or an awe-inspiring note within the event.
• 2-3 statistics per story.
• Highlight the more hopeful points that news sources can often shroud.
• Variety of sources
I have also chosen 12 of my own images from 2020 that were never shared but are a memory of an unforgettable year and used them as a jumping off point mapping 2020 onto 2021, a year with hopefully a little more light at the end of the tunnel and still a continued appreciation of the experiences we are able to have.
Visual
To break away from the flatness of communication and socialisation via video call, this project uses the Anaglyph 3D effect, so that when wearing the correct 3D glasses (red/cyan) each month’s image breaks away from the 2D surface it is presented on.
Using this library and technique gives the visuals a muted colour tone that, set against a black background, gives an ethereal appearance, speaking to the surrealism of the powerful impact the pandemic has had globally.
Based upon 3 different shape classes, 12 unique images are created. The common theme amongst them all is parametric forms, mapping Cartesian to Polar Coordinates and curved, circular forms. The uniqueness of these forms is guided by incoming data I’ve personally collected and collated in a JSON file. Both Daniel Shiffman and Paul Bourke have guided the process and design to create these shape classes. The Coding Train enabled me to understand how to convert formula presented by Bourke for the Elliptical Torus so I was able to generate my own code for this shape class. Shiffman’s conversion of H.Vogel's mathematical formula to generate a Phyllotaxis form inspired the sunflower type line shapes. Again, guided by Shiffman I was introduced to the Maurer Rose, which is a 2D form that I have introduced a third dimension.
Technical
I have used the P3D renderer for this project as this is essential for the Camera3D library. This library enables Processing to call the draw function twice in a single frame and render on two channels separated by a divergence factor called in the setup. The library includes many ‘Generators’ for different types of 3D output. For this piece I used the Red / Cyan Anaglyph renderer to match the type of 3D glasses I have. This offsets the channels, red and blue and green for cyan, right and left respectively.
The library also includes a postDraw() function which allows another single call after the double draw() call Anything in this function is drawn once and appears without the Anaglyph render. Specifically, I have used this to draw the calendar elements, as well as to output a single PNG of each Anaglyph render of the shapes. Due to the double draw call, I needed to increment some indexes by 0.5 rather than 1 as you would typically expect.
I have had to implement a work-around to be able to use the P3D renderer, the Camera3D library and export as a PDF. As mentioned above, the postDraw() function is used to output a PNG, a Anaglyph version of each month’s shape. The sketch runs this process for each month, generating the shape, saving the frame as a PNG once all the shapes have been generated, the newly exported PNGs are loaded back into the program as the PDF export begins. These PNGs are drawn, along with the other calendar month details on a page per month before the program completes the PDF and exits. A slightly convoluted method, but it enables a single contained process to generate the calendar. Unfortunately, Processing does not support this import of .TIFF files, raised in this thread ( https://discourse.processing.org/t/requirements-that-processing-has-for-loading-tiff-files/19281 ), which would have been preferred. To combat the raster nature of PNG images smoothing and increased pixel density is used.
There are two types of data input in this project, both self-generated. For the calendar, I populated a JSON file with the information for each month of 2021. The process of writing my own JSON file enhanced my understanding of extracting different data points from this format. It also means that I can reuse this data again, with very little tweaking. The stats are pulled in in a similar way and again could easily be updated. Having the linear constant of 12 months meant that data could be pulled using the same markers.
Summary
Entering the world of mapping mathematical formulae for geometry within code has been the most exciting part of this project for me, as it has pushed me past being bound by online tutorials. I’m only scratching the surface with what I’ve done within this project but reading and understanding Paul Bourke and others' work is something I will continue with. This goes also for the OpenGL processes that could be carried out as well as to create the Anaglyphs that Camera3D has helped me obtain.
References
Please see README.md