


WHAT IS YOUR NAME
By Clemence Debaig
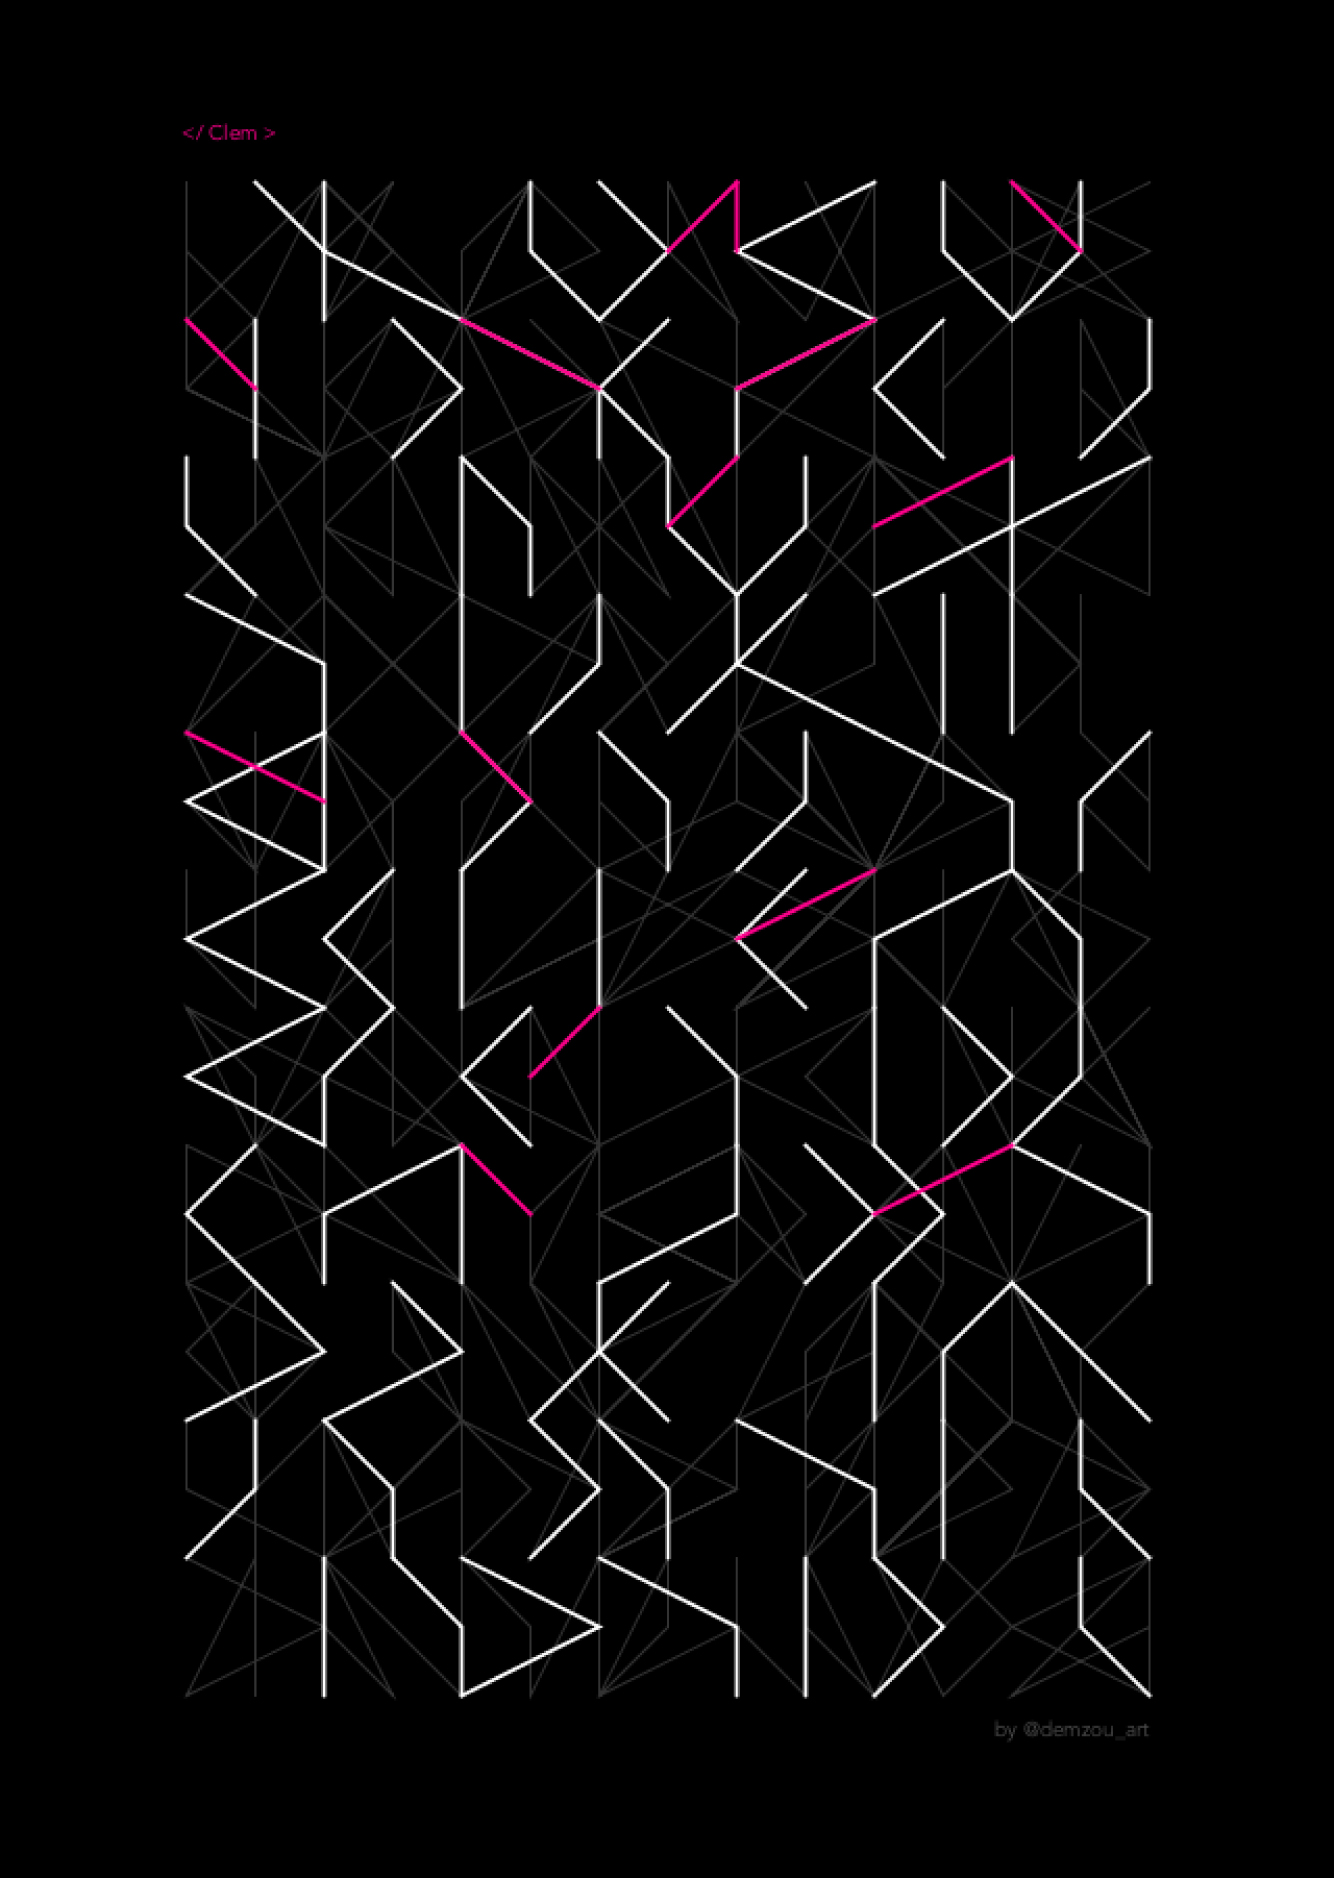
WHAT IS YOUR NAME is a generative programme that creates posters based on the data contained in the name of the person. It uses the ASCII values of the first name and last name, as well as the length of the strings, to influence the parameters of the sketch and create unique visuals per person.
Structure
Units
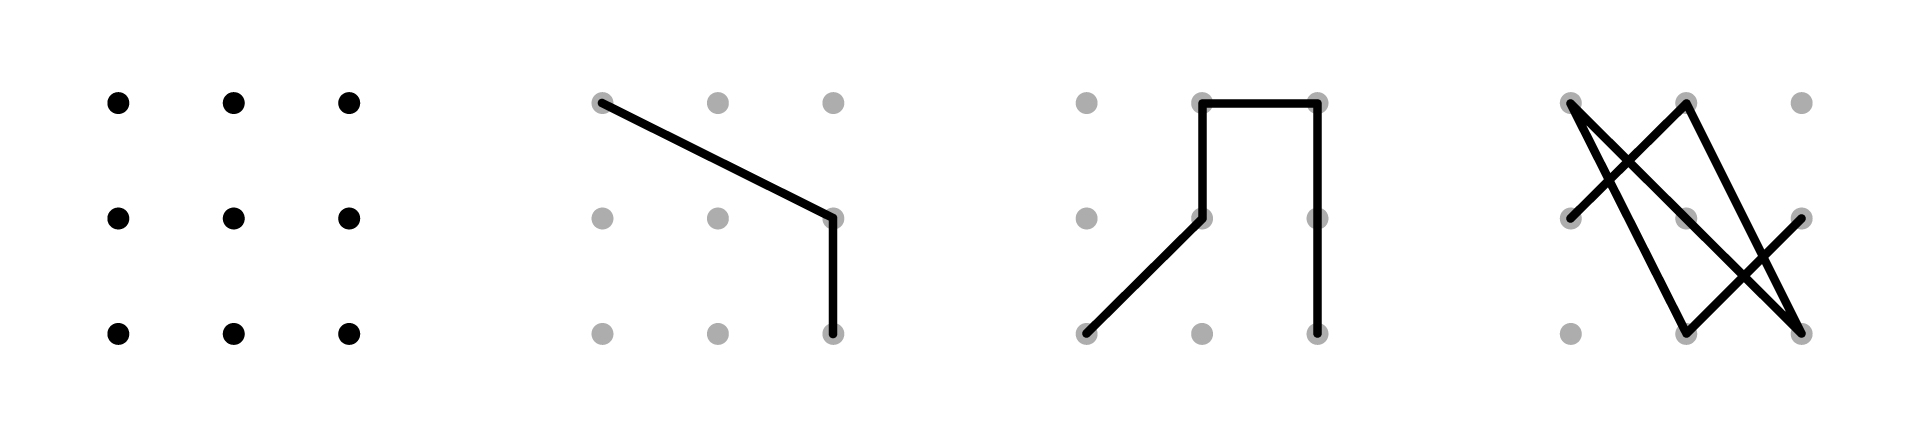
The visuals are created from 3 layers, each generated from a grid of units. Each unit is formed of 9 points joined randomly, creating lines and polygons. The number of points used per unit is one of the parameters influenced by the data. And the exact points used are picked randomly, creating different shapes each time the programme is run.
Grid
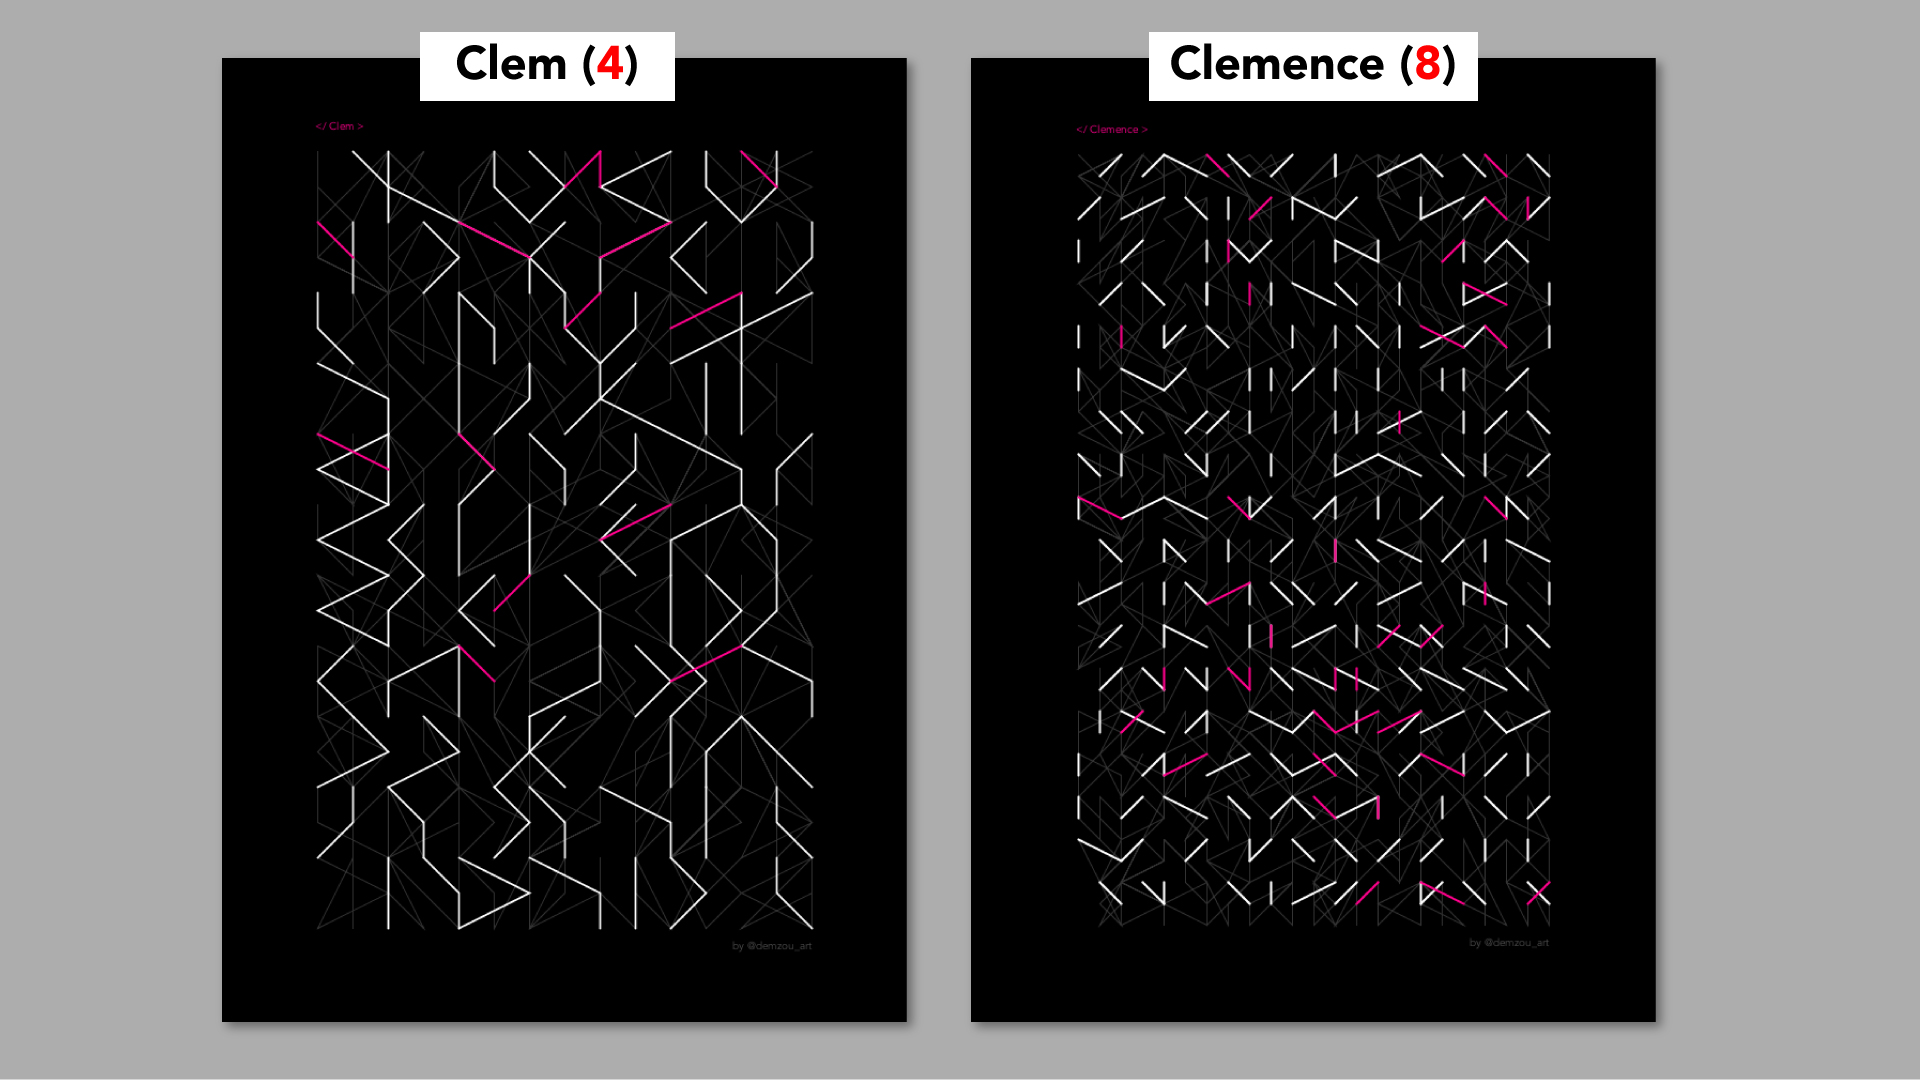
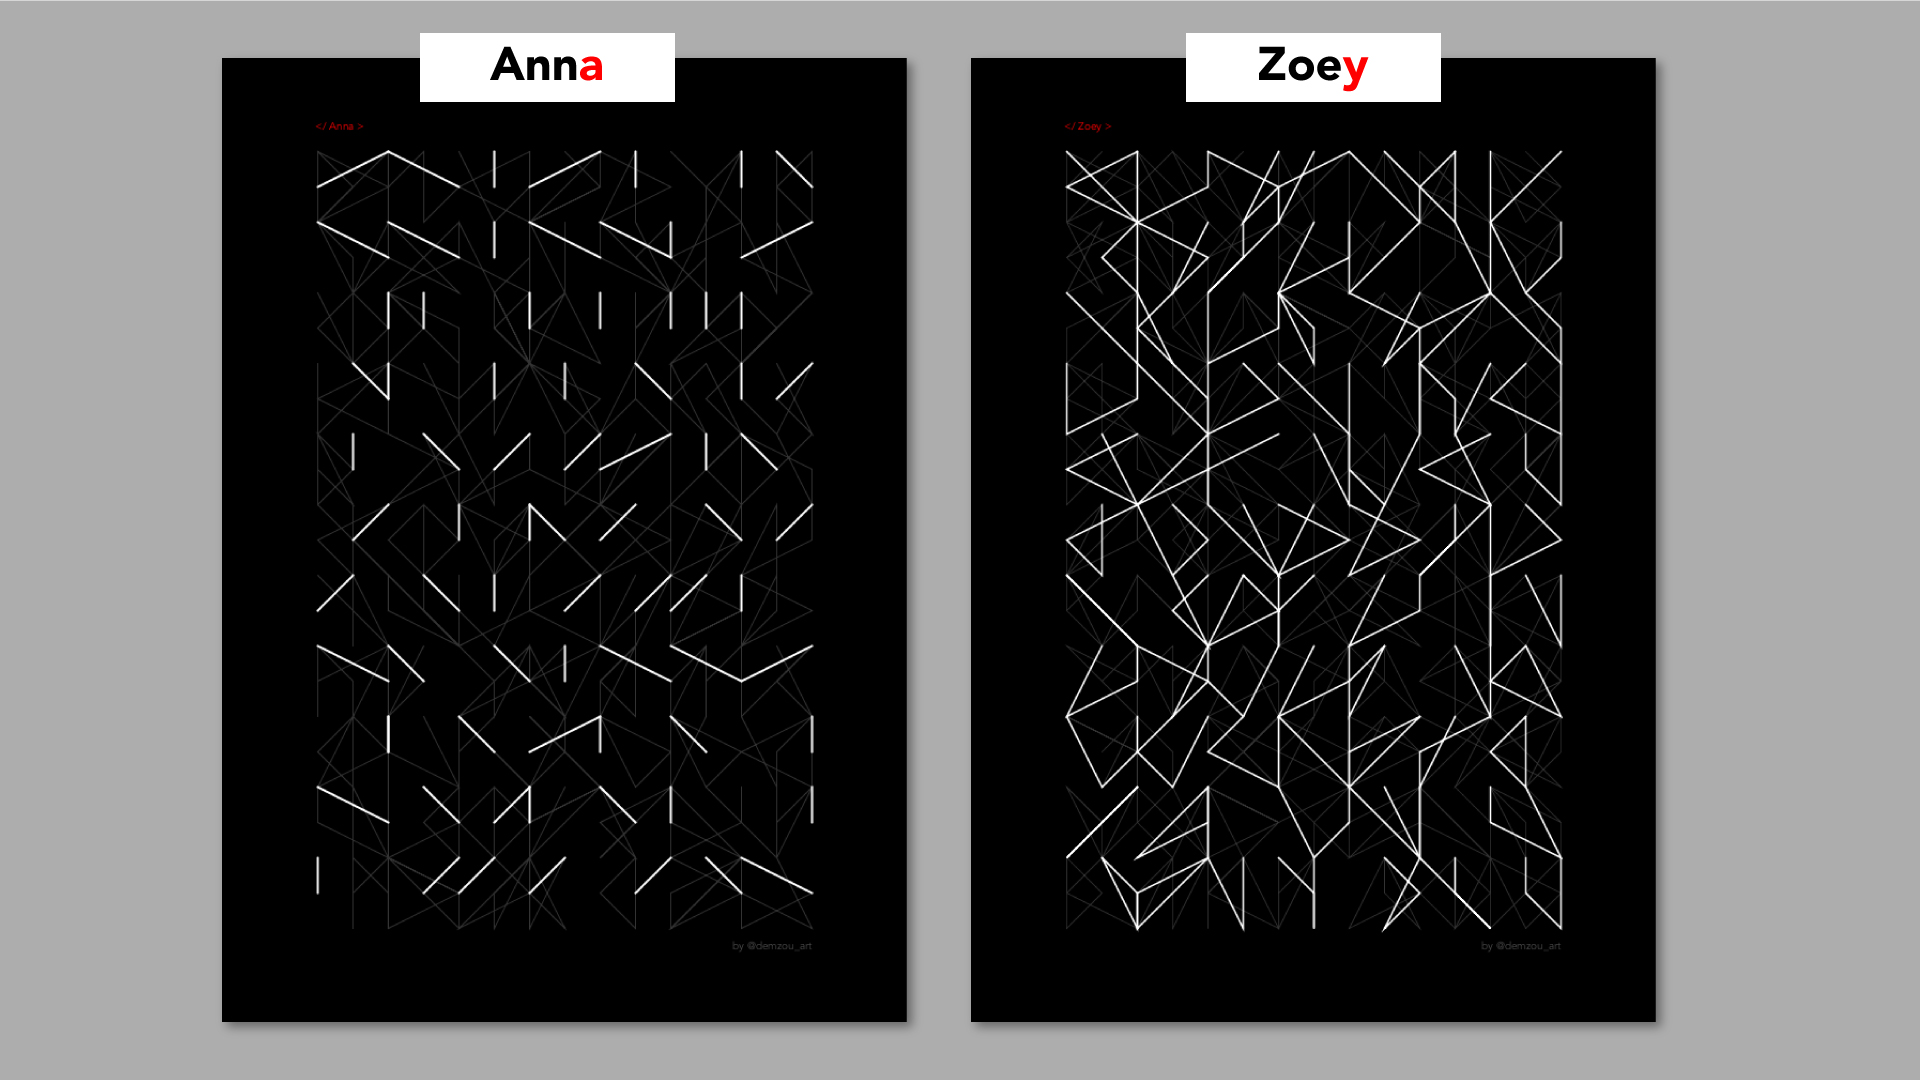
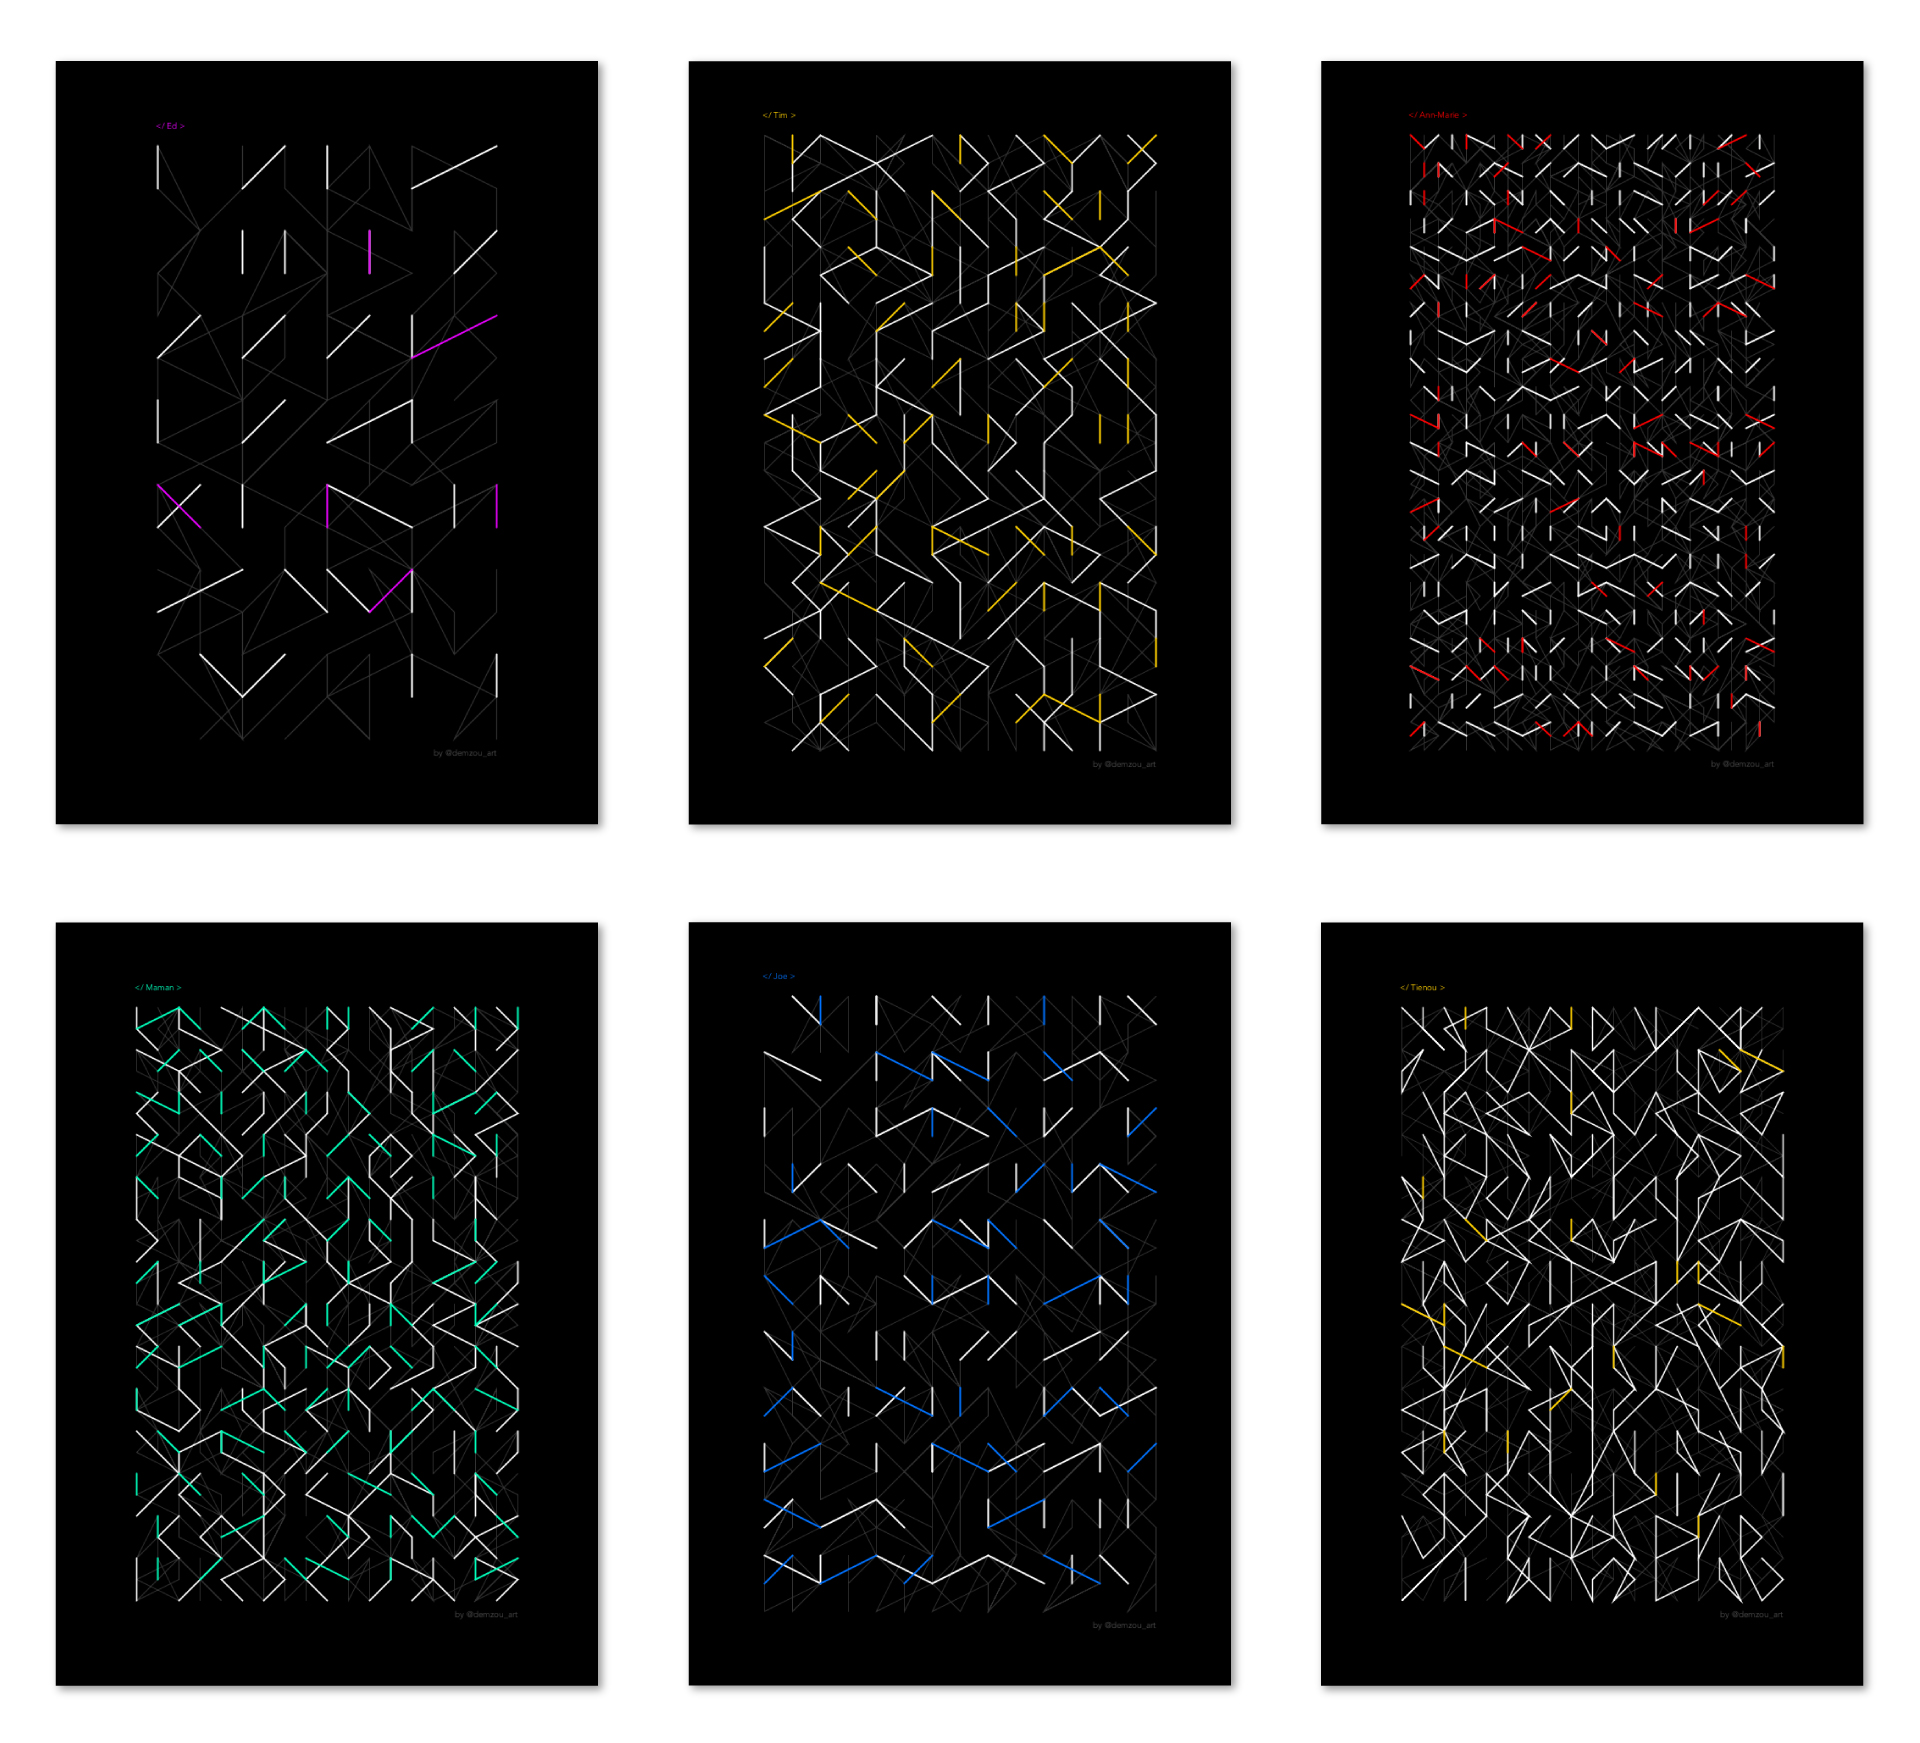
The tightness of the grid (how many units per column and per row), is defined by the number of characters in the first name. The longer the name, the more units are displays. So for a short name like Ed, there will be very few units presented, but a longer name, like Clemence, the final poster can look very intricate.
Grey layer
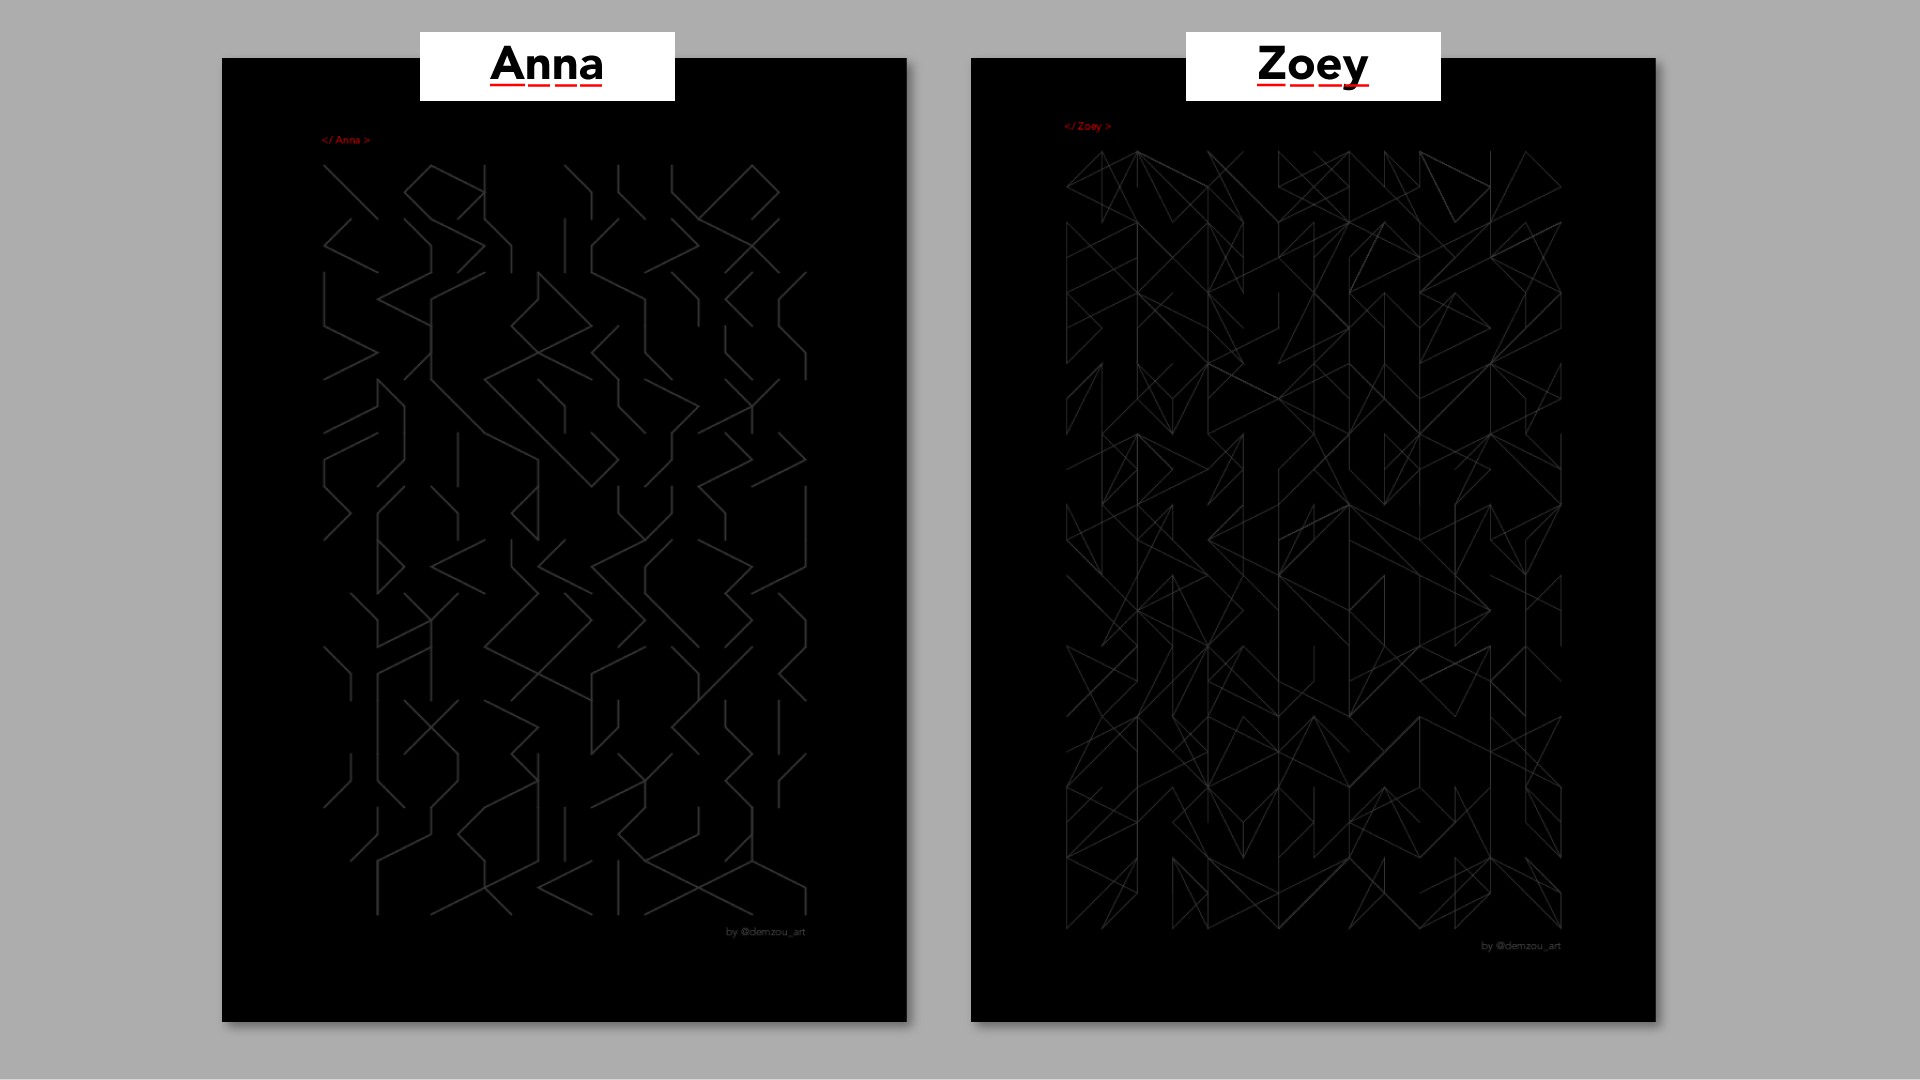
The parameters used for the grey layer depend on the average ASCII value of the characters in the first name. This data point is then mapped to define the number of points used to "connect the dots" in each unit, creating more or less intricate visuals.
White layer
Similarly, in the second layer (white), the number of points used to "connect the dots" in each unit depends on the ASCII value of the last letter of the first name. So, a name finishing with an “a” will have less white lines than a name finishing with a “y”.
Coloured layer
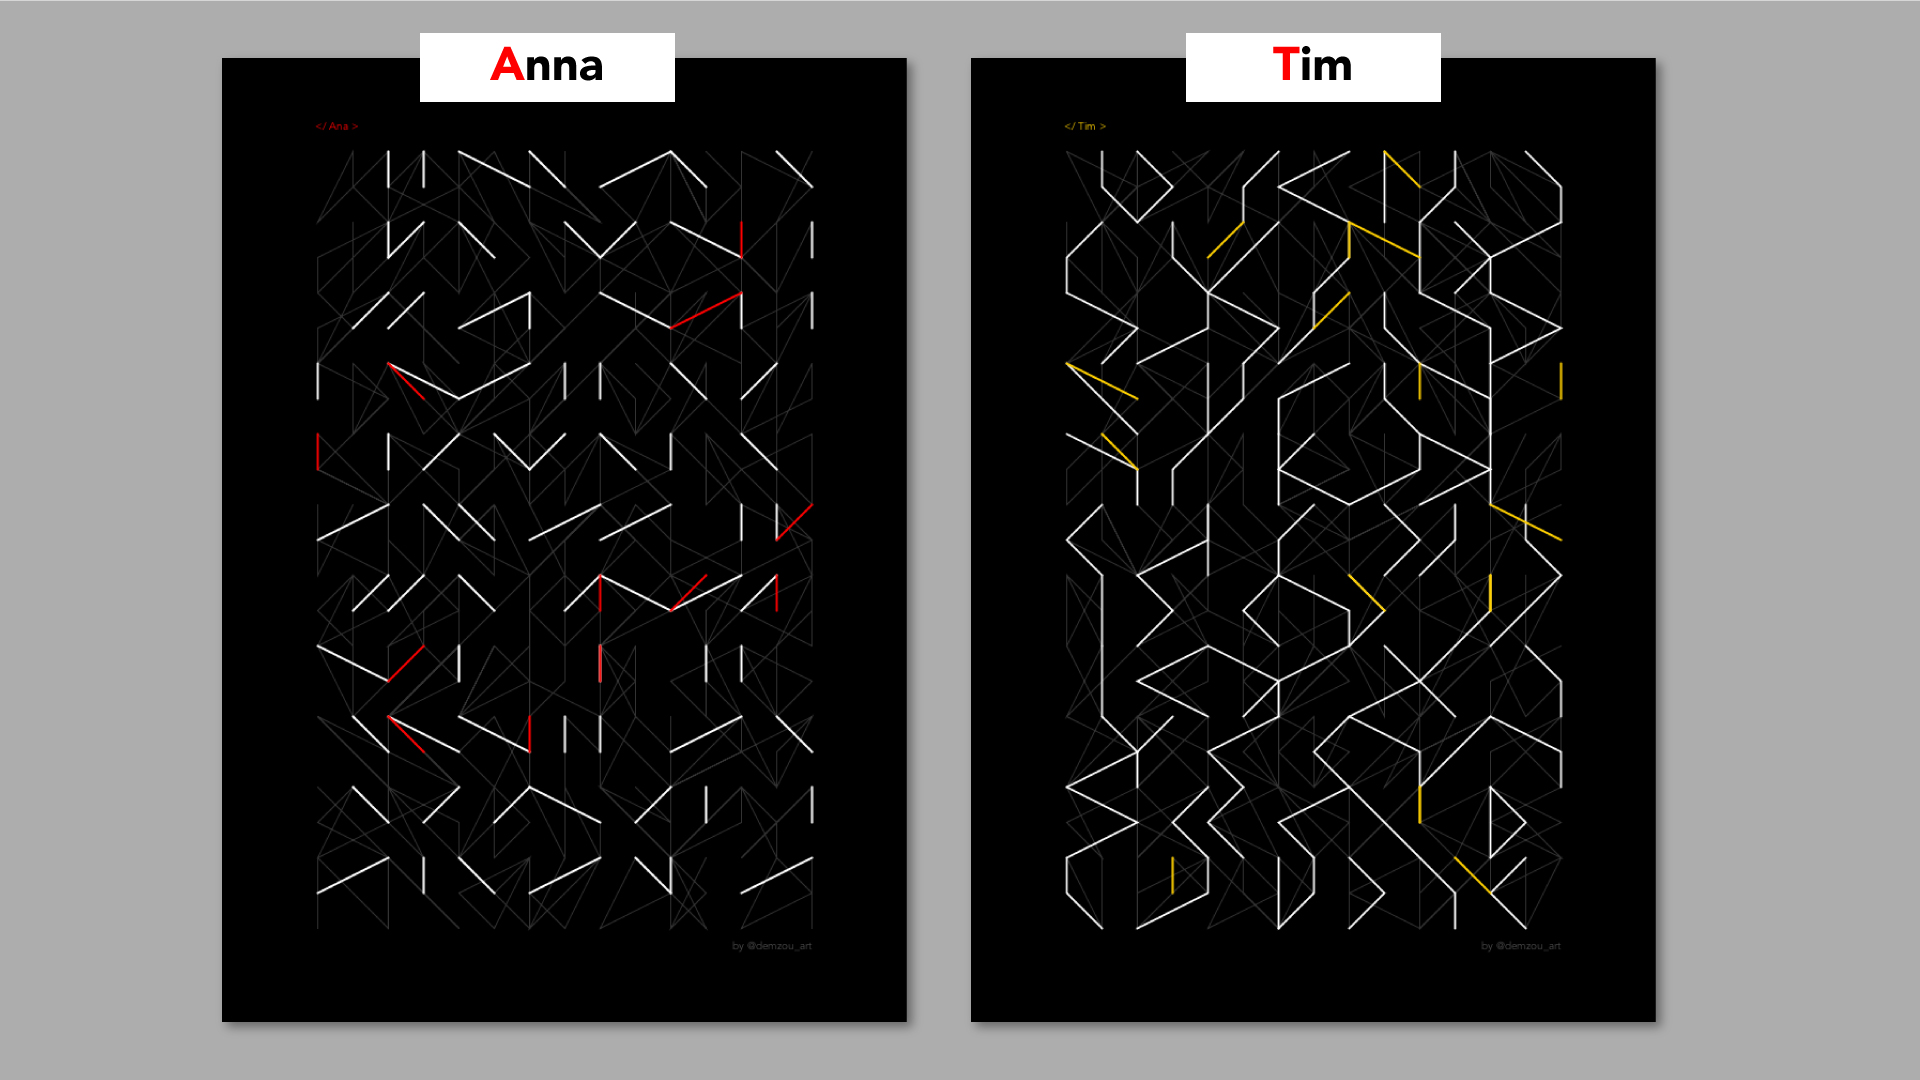
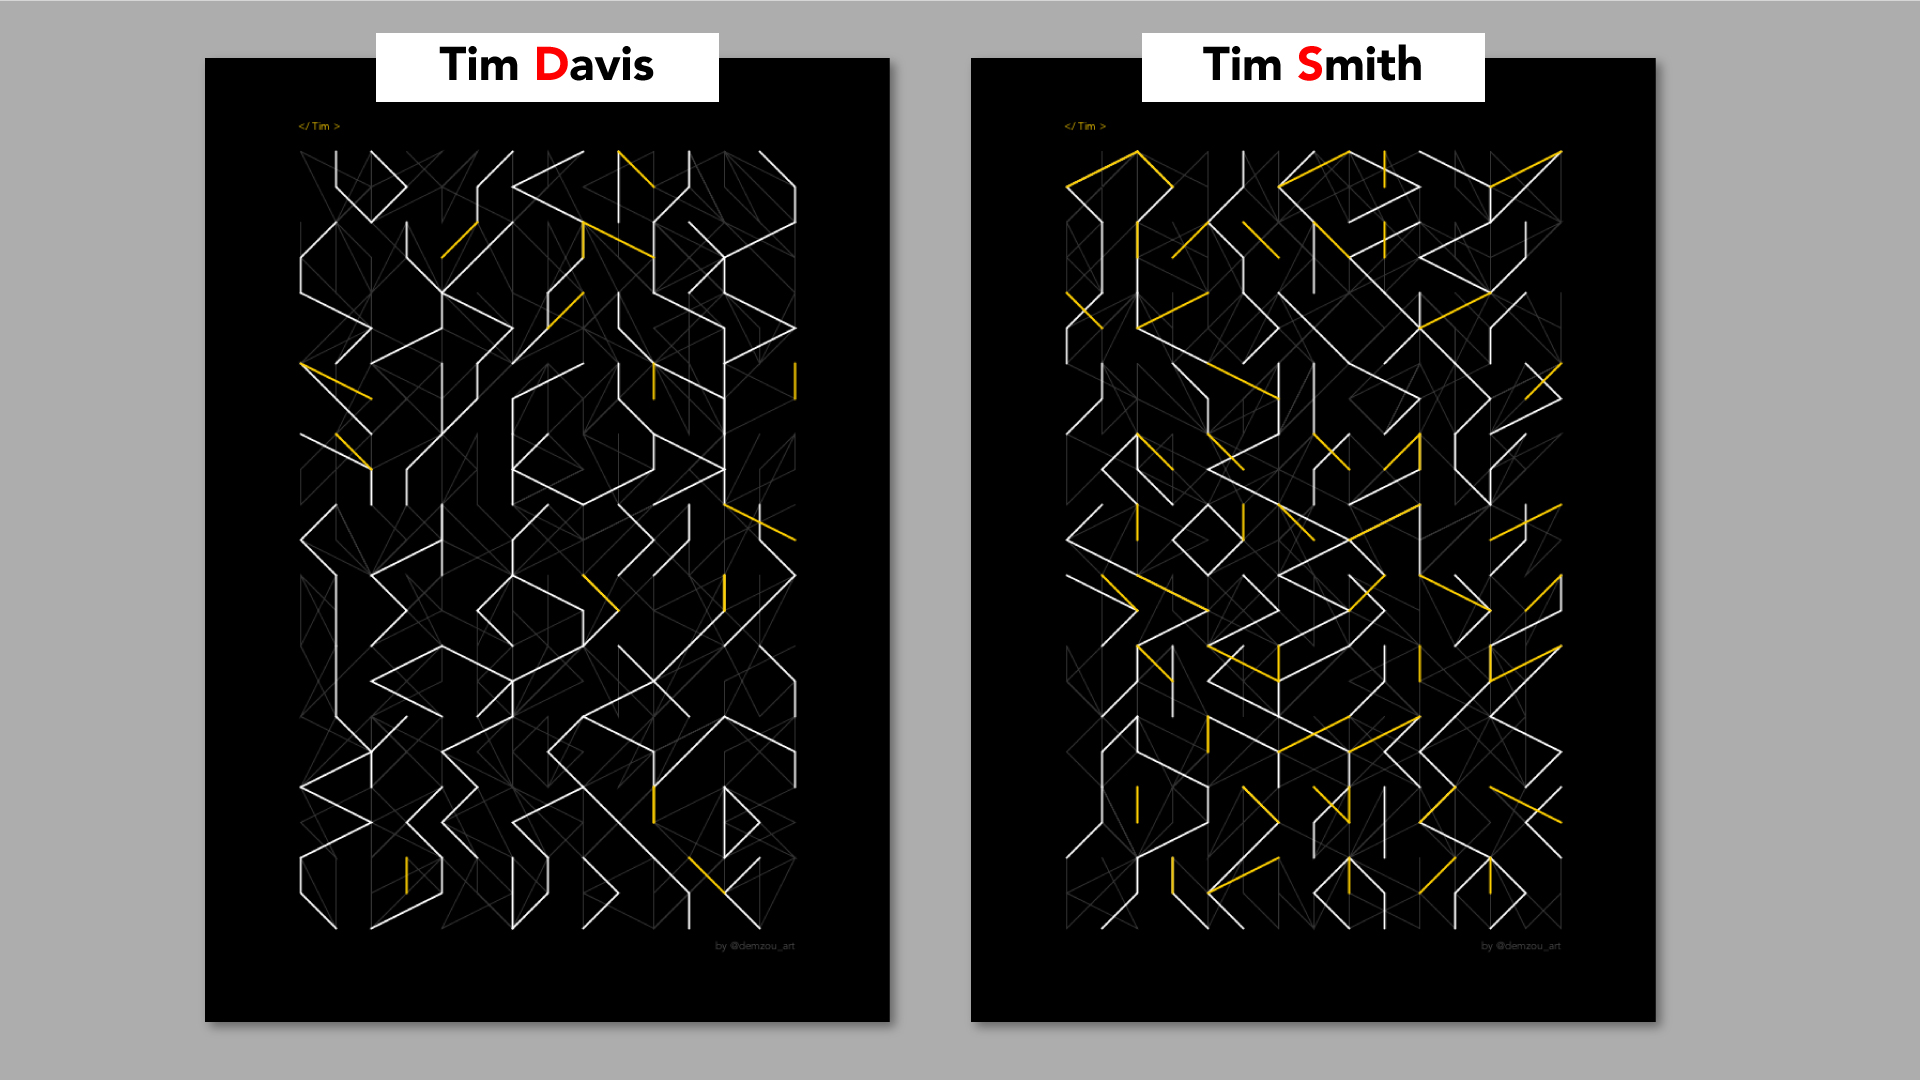
The hue of the colour is defined by the first letter of the first name, mapped against the colour wheel. For example, a poster for Ana would be red and a poster for Tim is yellow.
The amount of coloured segments is defined by a threshold on a random value to only have a few touched of colours. This threshold depends on the first letter of the last name. So a last name started with an “A” or “B” would generate a visual with barely any colours, where a last name with a Z would be very colourful.
Using real data
As a result of this project, I have created and printed personalised posters for my family and friends, in an A2 format. On top of making it a perfect Christmas present, it had given me the opportunity to explore a large variety (more than 20) of first and last names, and therefore forced me to adjust the different ranges and thresholds to make it visually pleasing in all situations.
For example, I had to cater for “Ed” and for “Jean-Francois”, giving me a very loose grid first, and a very (and almost too) intricate grid for the second one. Considering those, I decided to use mapped values instead of direct calculation as it allowed me to tweak the behaviour in more details.
Inspirations
Manfred Mohr
George Nees
Julien Gachadoat
Matt DesLauriers