


Kaleidoscope
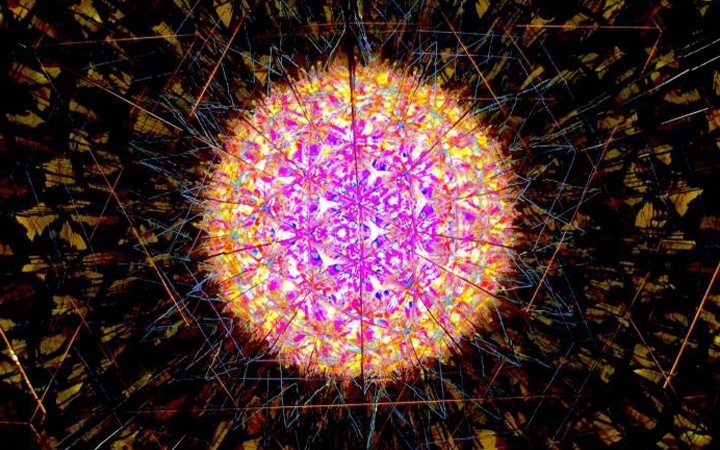
kaleidoscope is an interactive projection. It mainly explores the possibility of visualization in terms of emotion. It generates a kaleidoscope-shaped visualization by obtaining the audience's facial expression and hand movement information. It provides people with an emotional data visualization experience, guiding the audience to feel the aesthetics of visualization.
produced by: Boyuan Yu
Introduction
kaleidoscope is an interactive projection. It mainly explores the possibility of visualization in terms of emotion. It means data visualization can not only convey objective facts, but also convey the emotion behind the data rather than pure rational information.
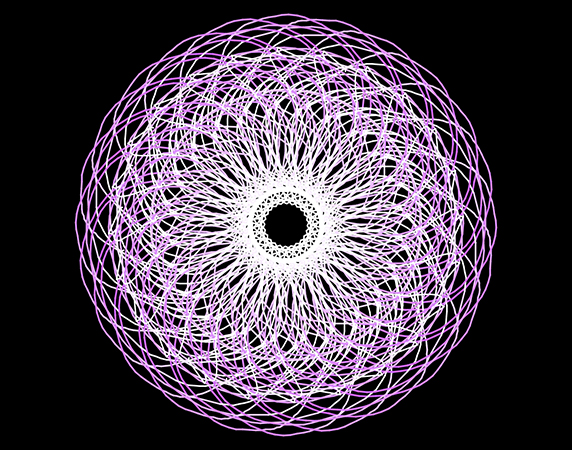
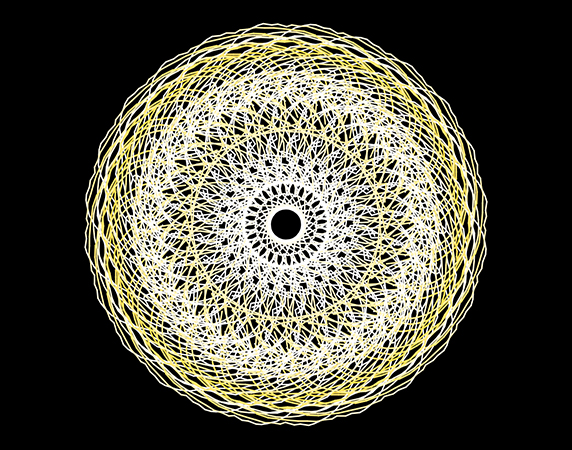
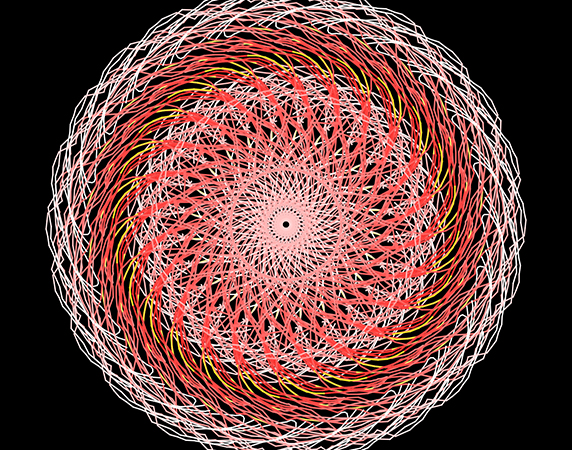
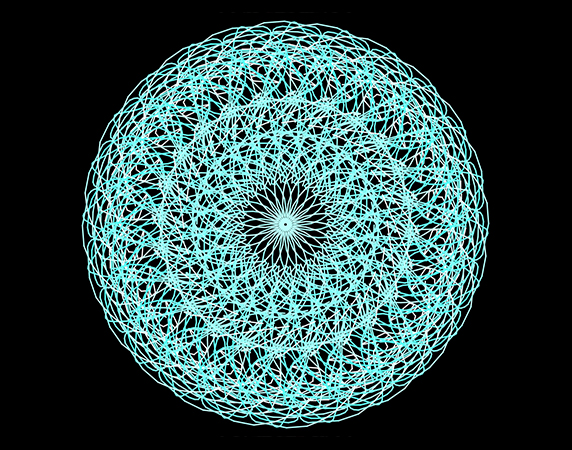
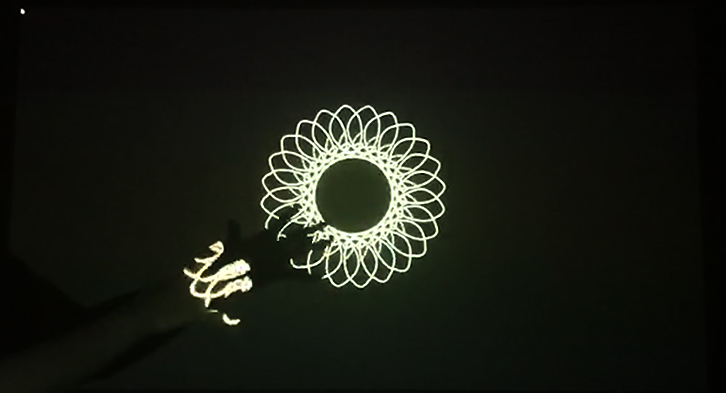
This project generates a kaleidoscope-shaped visualization by obtaining the audience's facial expression and hand movement information.
This project provides people with an emotional data visualization experience, guiding the audience to feel the aesthetics of visualization. And to a certain extent, it proves the possibility that visualization with emotions can help people make more ideal solutions.
Concept and background research
The project is inspired by various news about the COVID. Every day I can see a lot of data or information about this disaster on my mobile phone. The Director-General of the World Health Organization TanSaid emphasized that "behind these cold numbers are living lives, not mere numbers." and then I started thinking about data and visualization. What is the deep meaning of these cold numbers to people? Does the visualization convey a certain emotion behind the data? In addition to convey an objective fact, can it guide people's behavior through emotional data?
In 2016, Mona Chalabi proposed that data visualization has emotions. Behind every visualization, There seems to be a person to express the information and emotion it represents. Regardless of whether it is noticed or not, these emotions are usually reflected in the visual design and ultimately determine the image outcome.
Minsky also proposed the issue of computers and emotions, and wrote in the book "The Society of Mind". It said The problem is not whether intelligent machines can have emotions, but how can machines without emotions be intelligent ?
Besides, Donald A. Norman, the author of "Emotional Design", also proposed on the concept of "people-oriented" visualization, and advocated that data visualization, a purely logical technology, should be based on emotional system. Can better guide people to make ideal decisions.
Jonathan Harris, author of We Feel Fine, proposed the aesthetic value of emotion visualization: he said This kind of visualization works not only convey simple numbers, but also record the fleeting emotions of everyone's daily life, and see the story behind the data from a visual perspective, which is the beauty of emotional visualization.
Therefore, I took the visualization of emotions as the theme of this work, and hope to create an interactive projection to deliver emotional data to the audience through visualization.
Altas of Emotions is a visualization work from Dalai Lama and Paul Ekman's interviews with the public during the COVID. This project is composed of five colored areas of graphics, representing visual expressions of five common emotions: sadness, fear, joy, anger, and disgust. They show the relative strength of different mental states. This project creates a prototype that guides the development of emotions. The purpose is to help people get through every emotion and help the experiencer find a peaceful state.
We Feel Fine is a huge human emotion database established by Jonathan Harris. By searching the latest posted content on social platforms, it can grab the phrases of "I Feel" and "I AM Feeling", record the entire sentence, and identify the sentence Words expressing emotions, thus establishing such a huge emotion database. Then the data results are displayed in the form of dynamic representation with rich visual effects of the particle field. This work is a model of emotional visualization of a sample of the entire society.
My work has been influenced by 山見浩司 in terms of visual form. He usually use the kaleidoscope as the form of expression of his work. Narrow is an installation work with a kaleidoscope structure. The pattern of the installation is constantly changed randomly by wind and light, and the reflected image will never be repeated. He believes that the new patterns and styles produced by each creative reorganization of the kaleidoscope are abstract expressions of external things, and the information transmitted from the abstract world.
In terms of the interactive form of the work, I refer to the research (Gesture-Based Affective Computing on Motion Capture Data) and (Overview of Research on Face Detection), which explore the related applications of gesture behavior,facial information and emotional computing . I combine these two ways of expressing emotions, hoping to control the visual effects of visualization through gesture information and facial expressions.
In the visual form of this work, I refer to the kaleidoscope, and use this graphic as the visual effect of the abstract information of emotions.
Technical
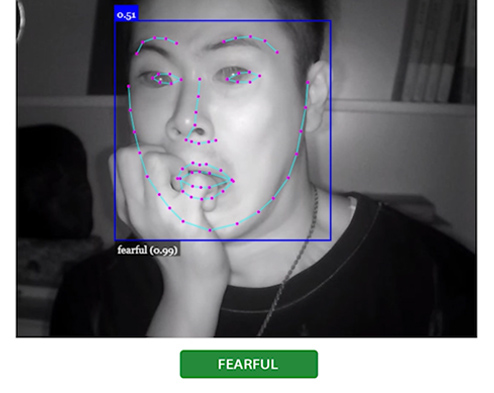
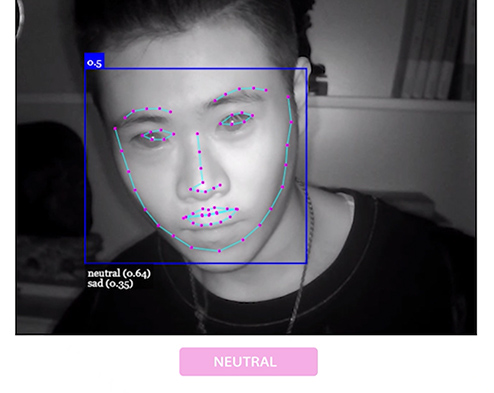
First of all is getting emotional information, this part took me a lot of time. I tried brainwave sensor and heart rate sensor from Arduino, and facial recognition form OpenCV library in processing. But these methods cannot guarantee the accuracy of emotion. After this I found out Faceapi: it is an open source nodejs library that uses Tensorflow to train the emotions according to different facial expressions: neutral:, happy, sad, angry, fearful, disgusted, surprised.
Secondly is use faceAPI: Since nodejs support is provided in max8, the face-api library can be used through nodejs. Establish a service at the local address, and then I use websocket to establish a network communication connection, and obtain the reliability of each expression calculated using faceapi based on the trained expression decide to the emotion model. final I send emotional data to processing.
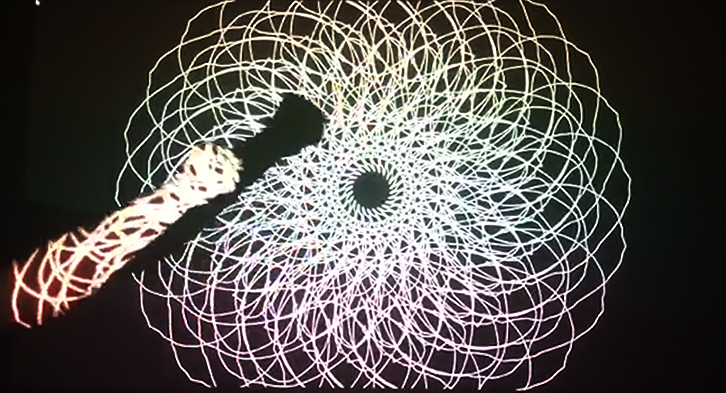
The third part: Through the KinectV2 library to receive the hand bone information from the Kinect2 sensor: what is used to determine the generation of the open and closed control graphics of the hand, the position coordinates of the motion track of the two hands control the speed and direction of the graphics generation, and the distance between the hands determines the diameter of the kaleidoscope. Receive seven kinds of emotion information from max8 through the OscP5 library, and classify them. Different emotions decide different colors. Thereby changing the color of the kaleidoscope.
Future development
First of all, the color of Kaleidoscope are changed through the classification of emotions, and the brightness is adjusted by the distance between the hands. This makes it impossible to accurately control the brightness during the experience, which leads to the inability to accurately convey the emotional level. In the future, I will further study the algorithm of controlling color brightness by emotional level, which will be a very important direction for the future development of the project.
Due to the limited space, the exhibition of works is not satisfactory. So I hope to use the reflection of the mirror to simulate the form of kaleidoscope more realistically. This will be a direction for the future development of the project.
Self evaluation
In addition to giving the experiencer the experience of emotional visualization, I also tried to prove that emotional visualization can guide people's behavior to a certain extent.
This project is similar to an interactive form of painting a kaleidoscope. It uses actions and expressions to output emotional information, which is reflected through emotion visualization. In this process, the experiencer will use different actions and facial expression to control, In order to pursue graphic beauty and the color and shape of the graphics. To a certain extent, it can also be understood that the visualization of emotions guides the behavior of the experiencer.
Generally, the project has realized my related research on emotion visualization and presented it with relatively good visual performance. However, this item is the lack of the project in terms of the brightness of the graphic color, and will be the main direction of future development.
COVID interruptions
During the COVID, the biggest problem is the blocking of foreign networks. China's browsing range of foreign websites has narrowed again, and VPNs have been blocked on a large scale. Therefore, the inability to obtain references and technical support is the biggest problem faced during the epidemic. Therefore, we can only seek technical support through the Chinese version of HITHUB. Although it was more difficult, in the end a kind netizen helped me solve the problem. References can only be referenced through Chinese translated books, which has increased a lot of reading.
The second problem is the limitation of hardware equipment support and display. Since KinectV2 has long been discontinued, and it cannot be purchased due to the impact of the epidemic, it can only be leased from game console sellers. Regarding the limitations of the exhibition, I can only give up the use of mirrors to display the exhibition through the direct projection of the projector.
Source code
https://github.com/justadudewhohacks/fac e-api.js
References
Design, S. 2016. The Ekmans' Atlas Of Emotion. [online] The Ekmans' Atlas of Emotions. Available at: [Accessed 13 August 2020].
Harris, J., 2016. We Feel Fine / By Jonathan Harris And Sep Kamvar. [online] Wefeelfine.org. Available at: [Accessed 22 August 2020].
Qingfeng Wu, Changle Zhou, Chaonan Wang. Content-Based Affective Image Classification and Retrieval Using Support Vector Machines[J]. Computer Science, 2005: 156.
Picard R W. Affective Computing. Cambridge[M], MA: MIT Press, 1997:90-110.
Minsky M. The Society of Mind[M]. Simort&Schuster, 1985: 80-86.
Chalabi, M., 2016. Informing Without Alienating.
Adhanom, T., 2019. Technical Guidance Publications. [online] Who.int. Available at: [Accessed 12 June 2020].