The Sleep Cycle
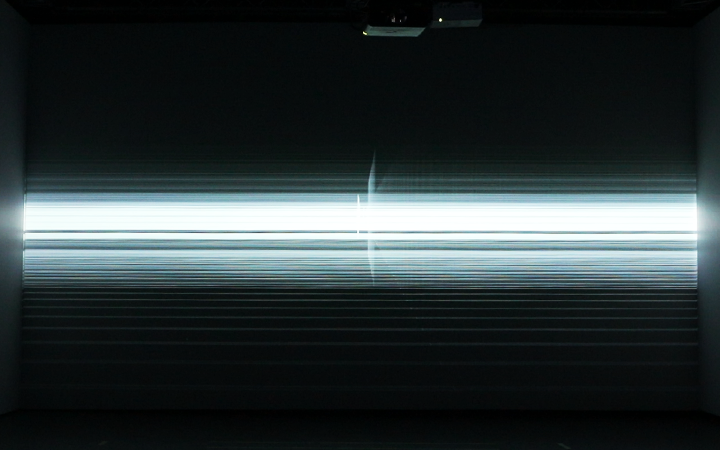
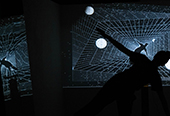
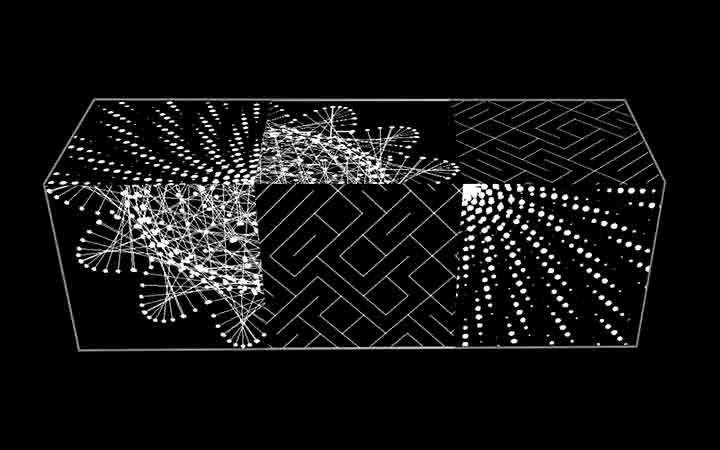
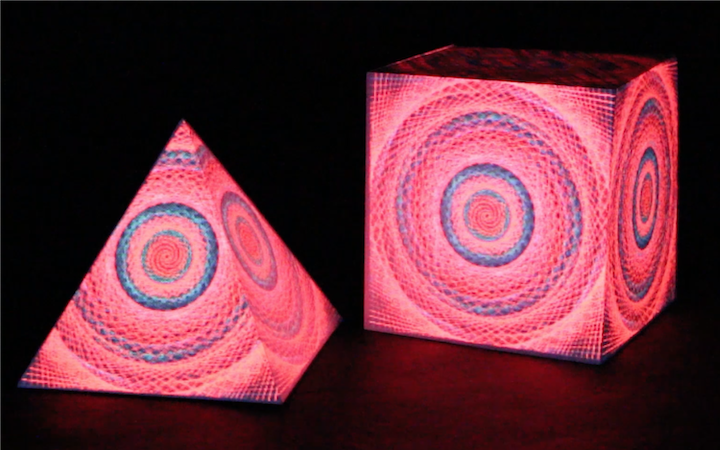
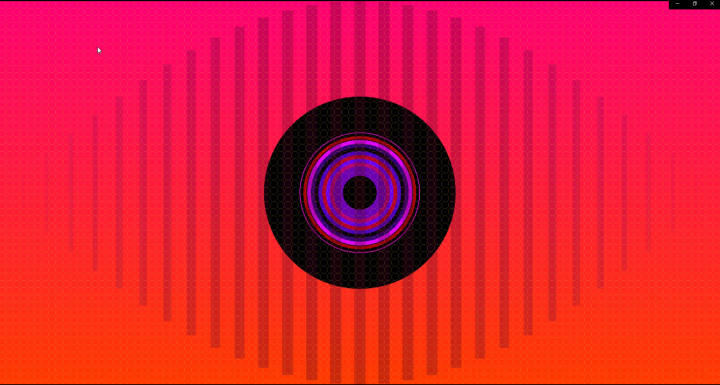
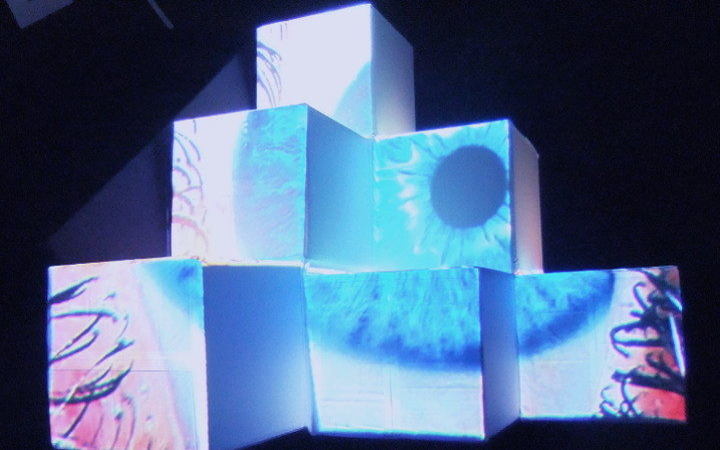
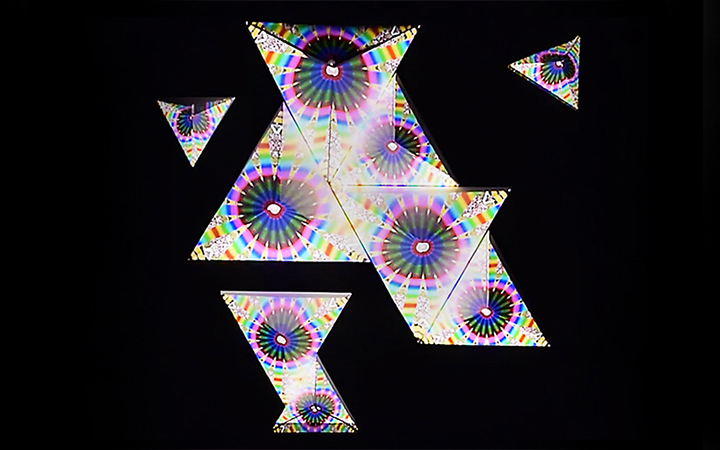
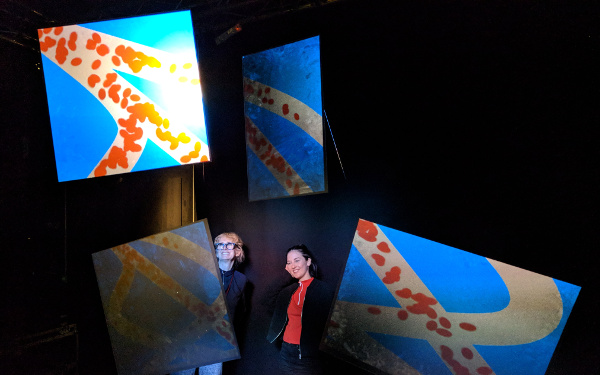
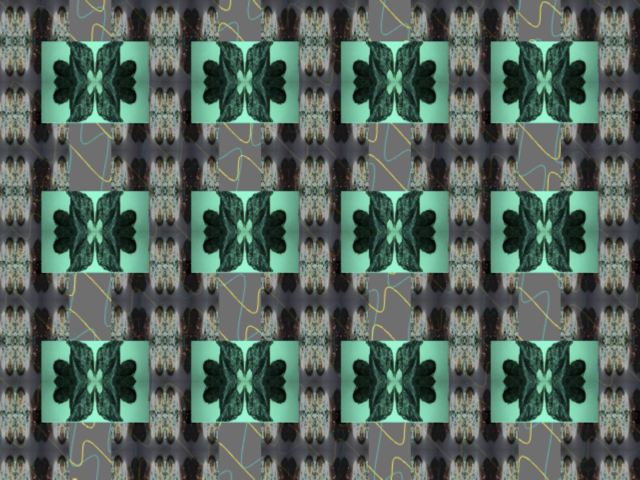
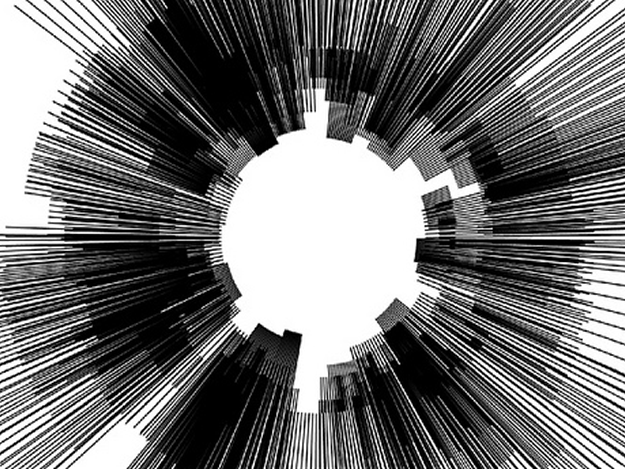
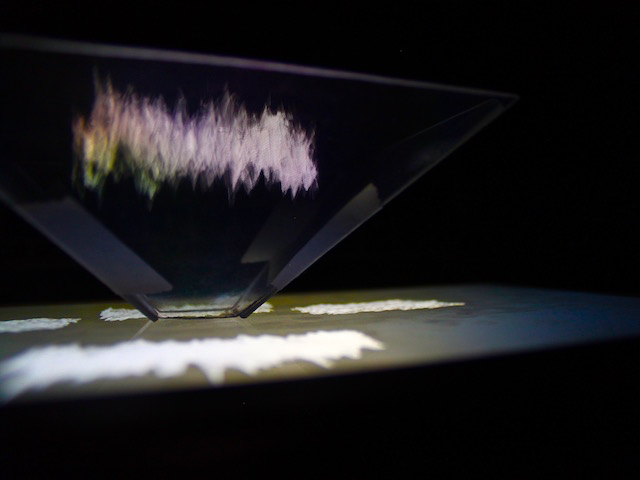
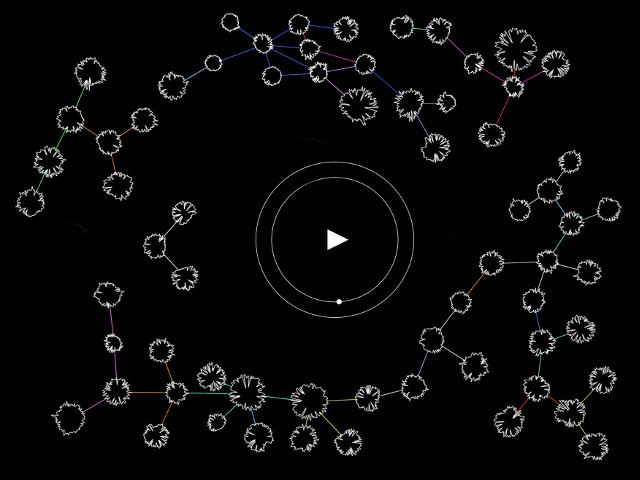
This projection mapping piece is a visual representation of the different phases of brain activity during one night/one full sleep cycle as represented by simplified versions of EEG waves.
produced by: Hannah Pamplin
Introduction
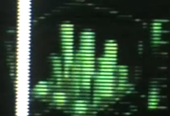
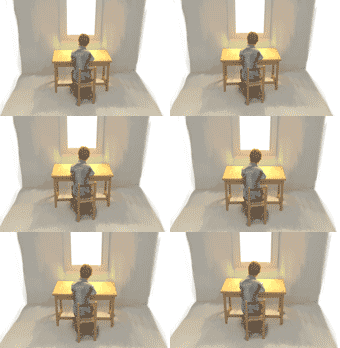
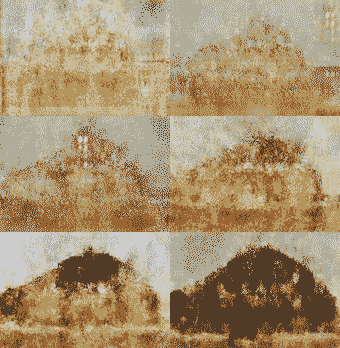
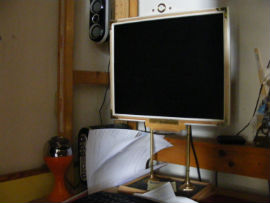
After making the decision to project onto three cubes, deciding to treat them as if they were EEG monitors, observing a patient during the night. Each cube acts as a monitor to display two of the four different wave-type stages observed during the typical sleep cycle, and the final cube or screen records time passing by way of 'watching' the sun-set and the moon rise. The sleep stages represented include; N1 categorized by theta waves with low amplitude and high frequency; N2 categorized by sleep spindles, k-complexes, and a biphasic wave; N3 categorized by delta waves with low frequency and high amplitude; and the REM, categorized by beta waves that resemble EEG patterns as observed during concentrated mental activity.
Concept and background research
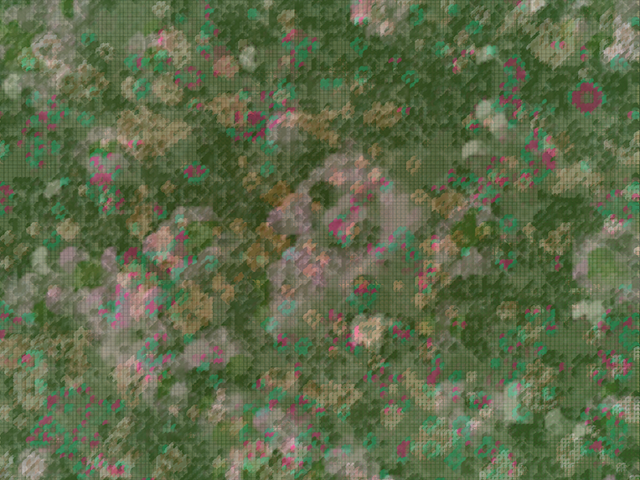
During the very first stage of research, I was looking for images that I felt one could easily imagine and predict movement from, coming across an image from examples of generative art on Pinterest that depicted the composition of harmonic curves. Given my background in psychology, this image immediately reminded me of fMRI or EEG wave patterns. I felt that this was a good place to start as I already would have an idea of what some parts of the finished product should look and should move and that it ticked one of the boxes from the project brief by containing examples of sine wave motion.
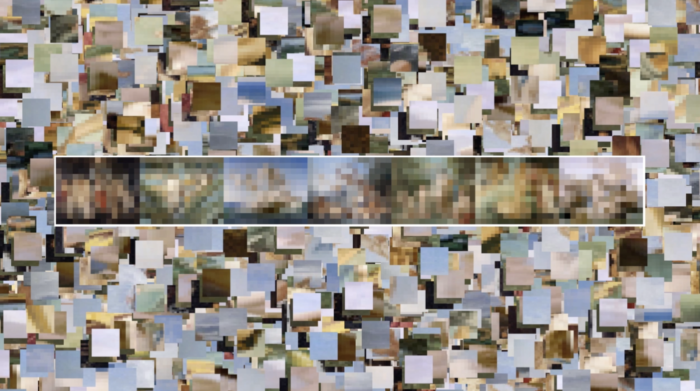
The next step in my planning was to look at how this idea, or similar, had been implemented before. It was then I found the paper 'Brain Art: Abstract Visualisation of the Sleeping Brain' from Daria Migotina, Carlos Isidoro, and Agustinho Rosa, as presented for the GA2011 XIV Generative Art Conference. Here, the authors took data from EEG waves produced during sleep and transformed them into abstract and pleasing visual art pieces; which I thought was a truly novel way of displaying data, finding itself right at an intersection of art and science. Although visually my finished piece looks nothing like this, it was the idea of creating art from data and EEG waves that inspired me.
The final idea that I settled on was a visual representation of one night's sleep cycle, where we can see a simplified version of at what points during the night one passes through different stages of sleep, and what brain activity (in the form of EEG) waves is being produced at each moment.
Technical
This piece used OpenFrameworks and Windows Visual Studio 2017 as a platform and c++ as a coding language.
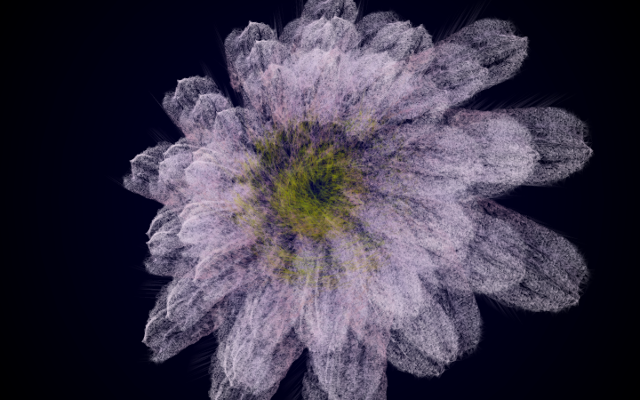
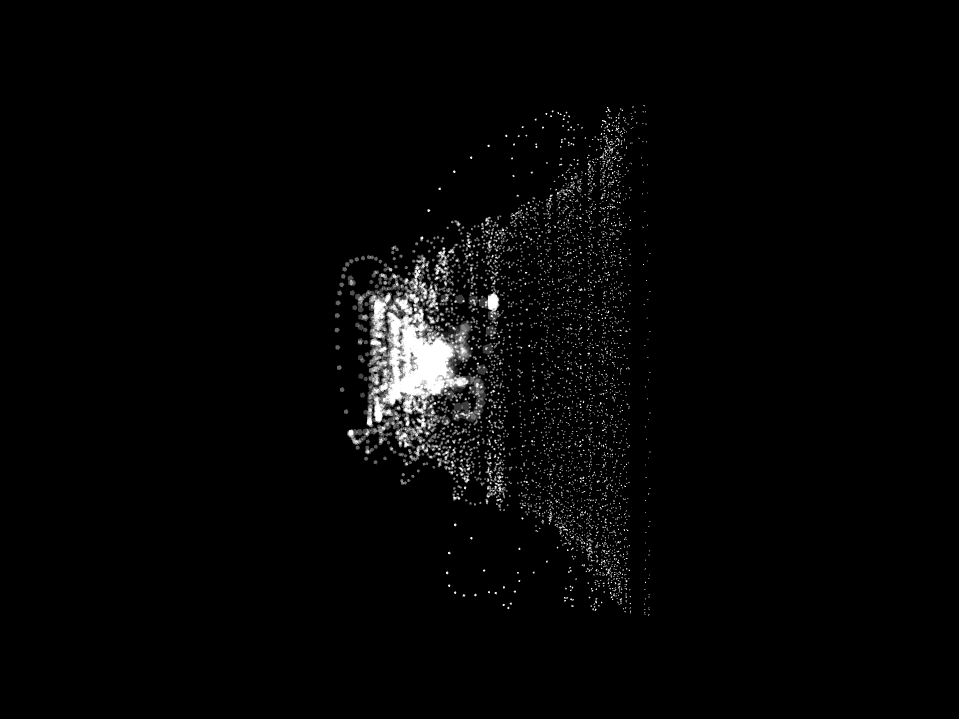
To produce the 'theta' waves as depicting N1, N2, and REM stages of sleep the ofNoise function was used, this code was borrowed and modified from examples I found on junkyoshi's blog, and the post entitled 'Make waves with noise. openframeworks', after searching for animated versions of similar waves to use as inspiration. The movement of N3 waves is created borrowing code from the same blog, and the post entitled 'particle sine wave. openFrameworks'.
Future development
This is a simplified version of a sleep cycle. In reality, we transition from N1 to N2 to N3 to N2 to N3 and finally to REM, with this repeating four to five times per cycle and each cycle lasting approximately 90 to 110 minutes, and in an ideal world my piece would be more scientifically accurate.
Self evaluation
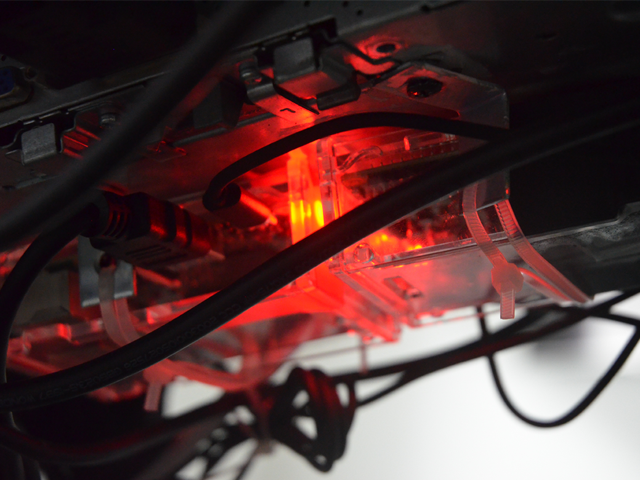
Overall, I am proud of what I have produced, I hope that it gives enough information so that one could understand what is attempting to be represented without too much prompting. I do think that it could have been smoother, as I felt that I encountered many moments where I was simply guessing my way through what might work, through trial and error, rather than truly understanding exactly what each line of code was doing and changing. Had I had a better understanding of ofxPiMapper, I would divide my presentation into three separate scenes so that I could individually project them onto the three cubes, as different monitors, so that they could be moved more freely.
References
Migotina, D., Isidoro, C. and Rosa, A., 2011. Brain Art: Abstract Visualisation of Sleeping Brain. GA2011: Generative Art Conference, [online] XIV, pp.141-153. Available at:
Junkiyoshi.com. 2021. 2020年5月3日 – プログラミング De 落描き. [online] Available at:
Junkiyoshi.com. 2021. 2018年9月11日 – プログラミング De 落描き. [online] Available at:

