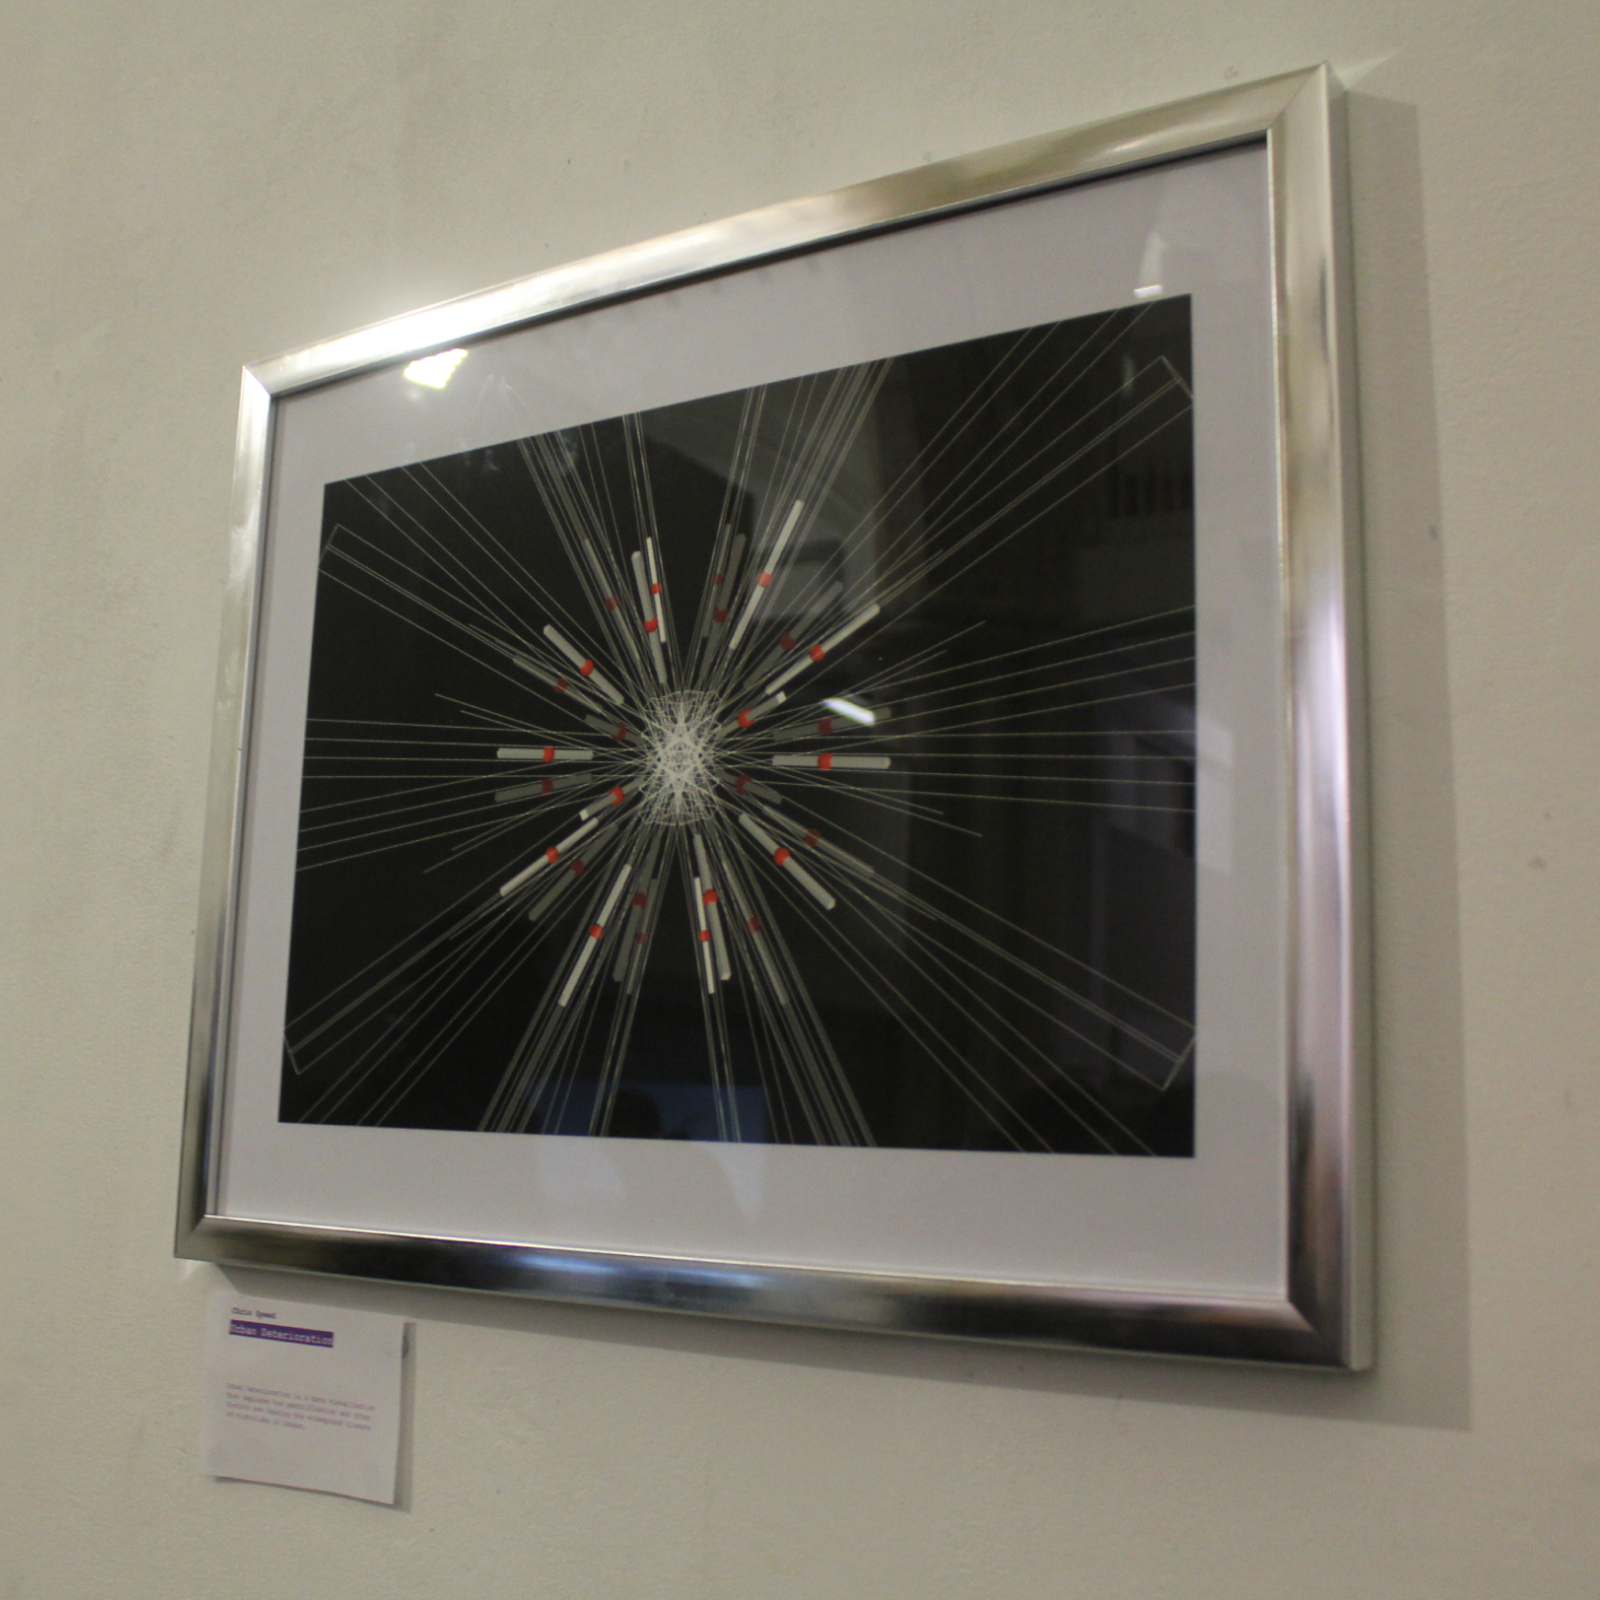
Urban Deterioration
For my final project I created a visual story that comments upon some of the issues surrounding gentrification and how it is affecting London’s nightlife.
produced by: Chris Speed
Introduction
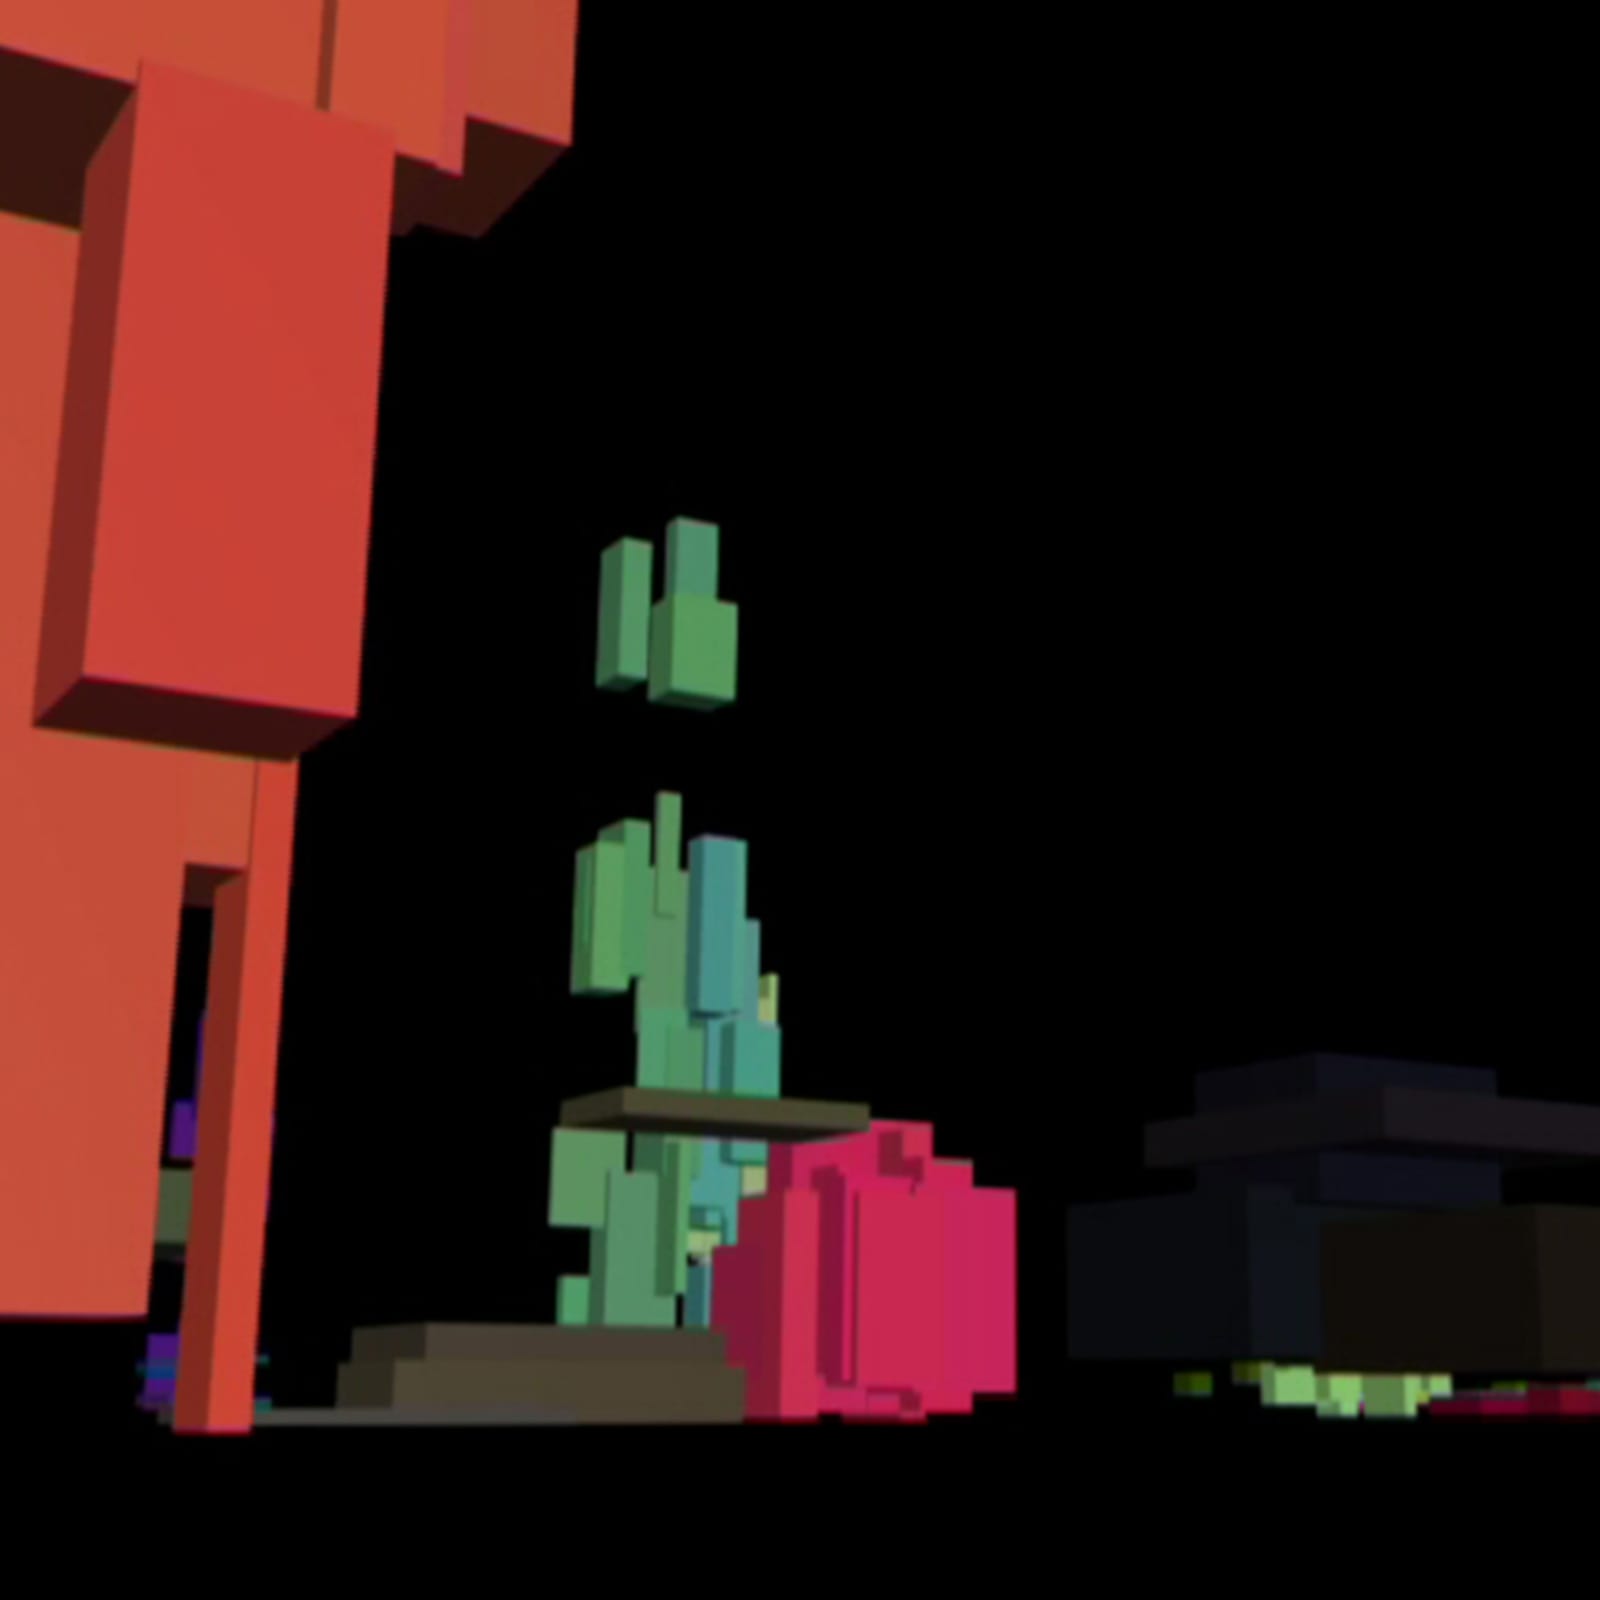
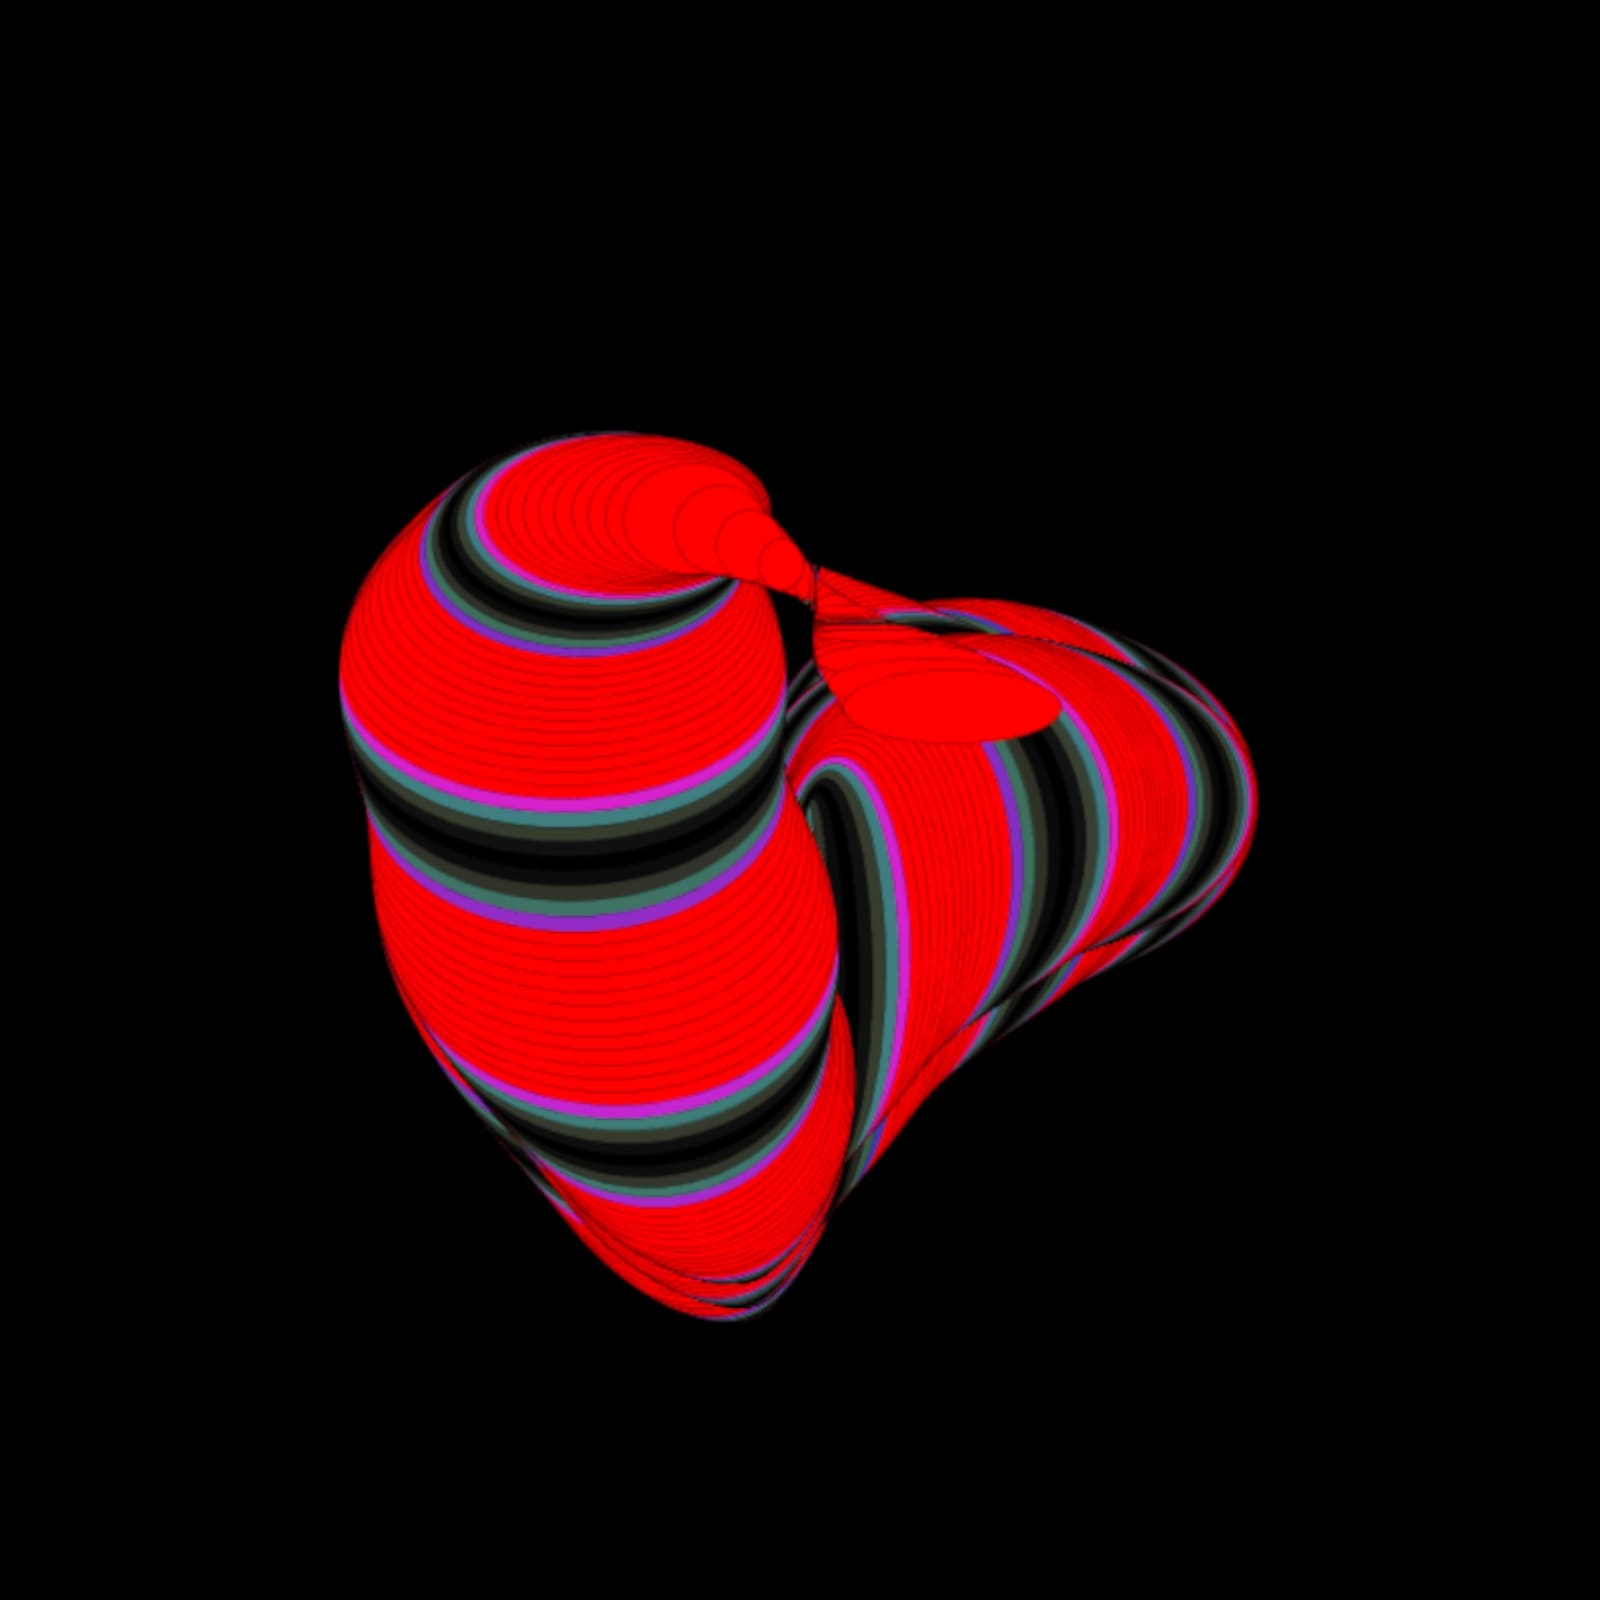
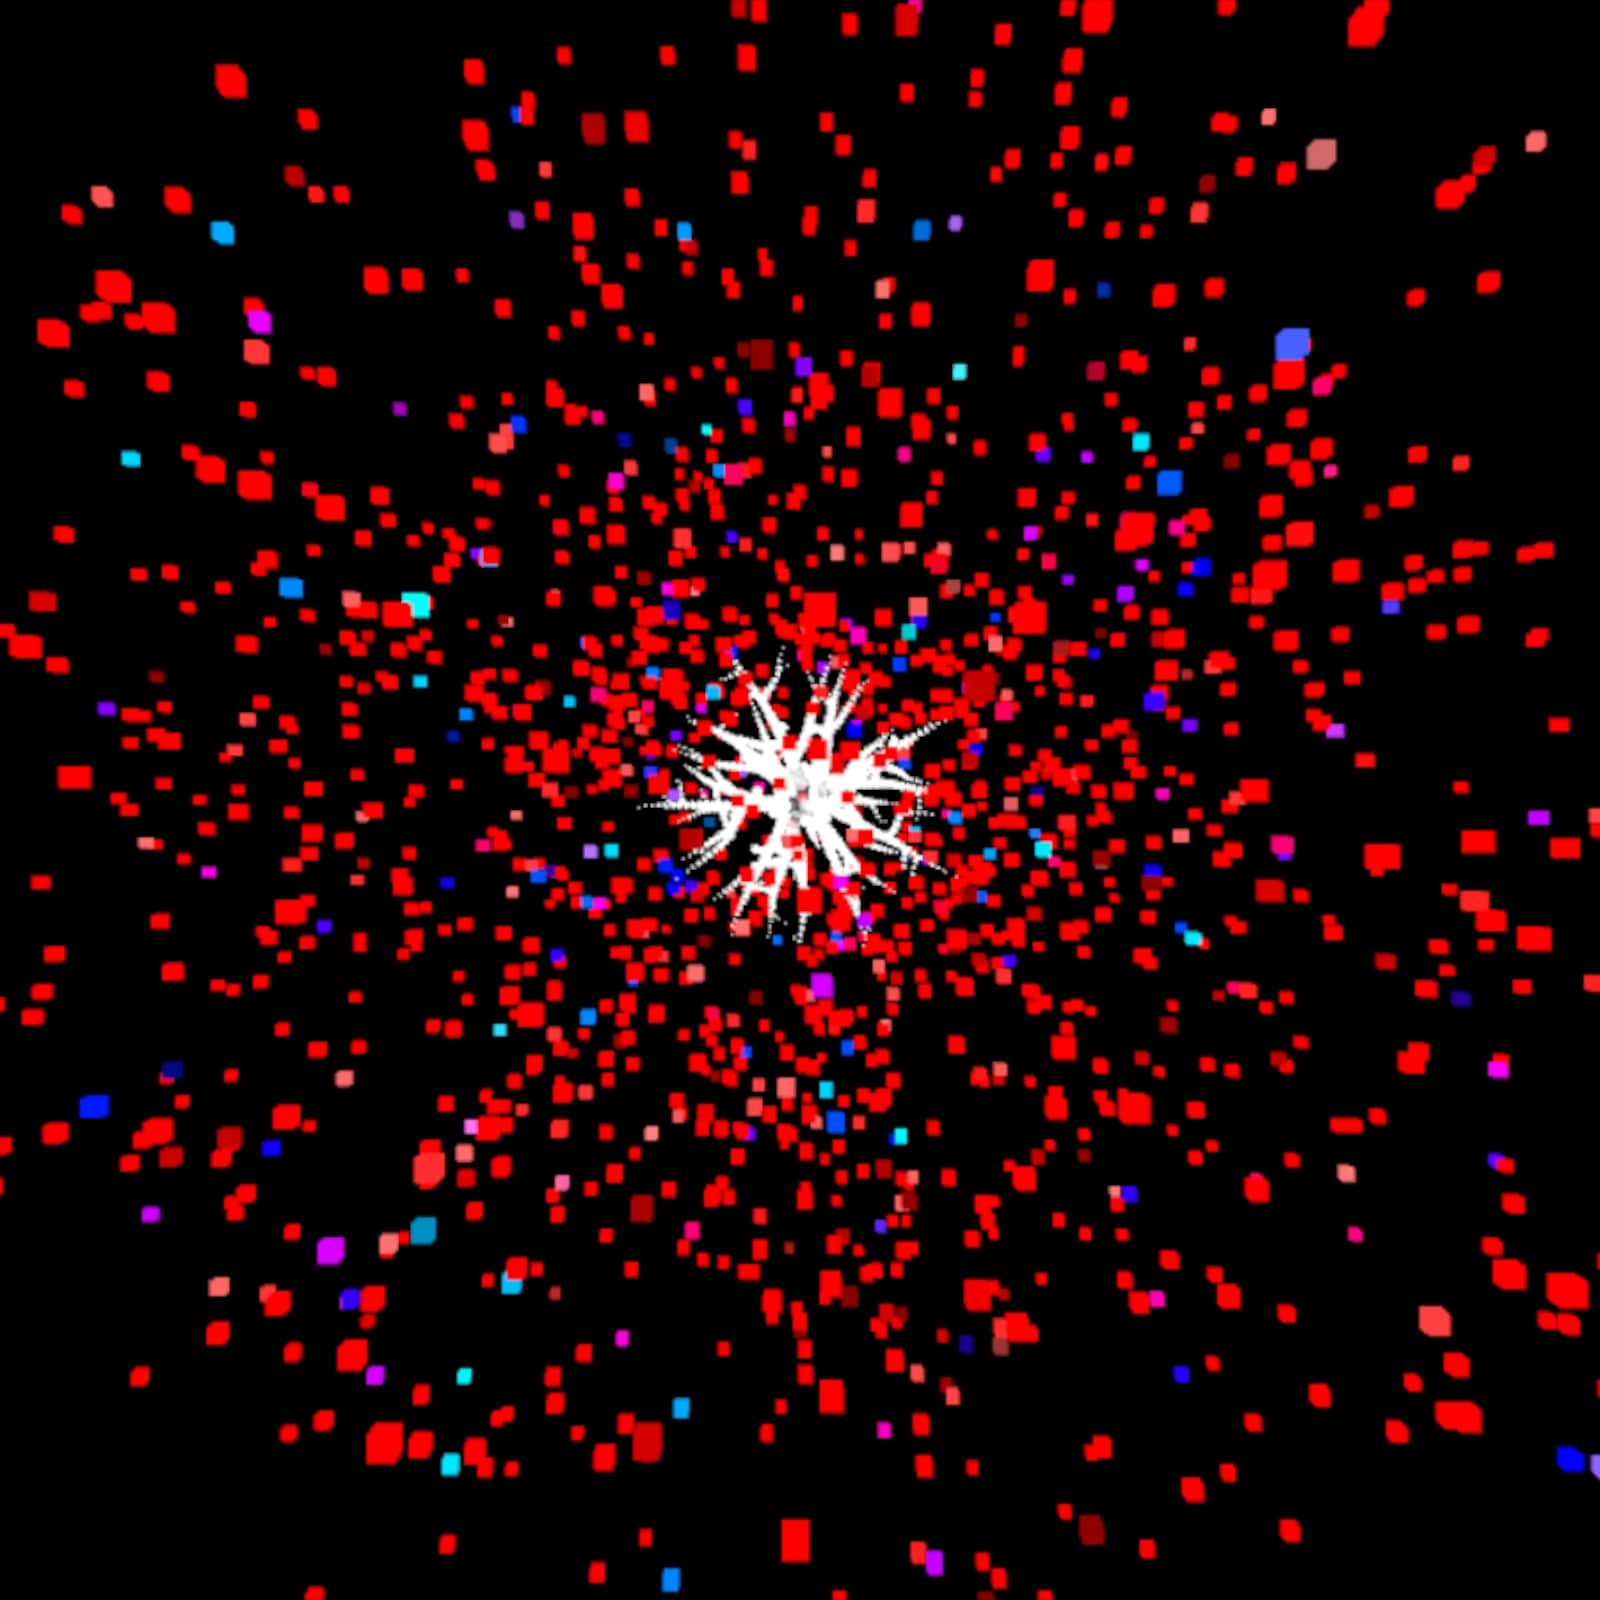
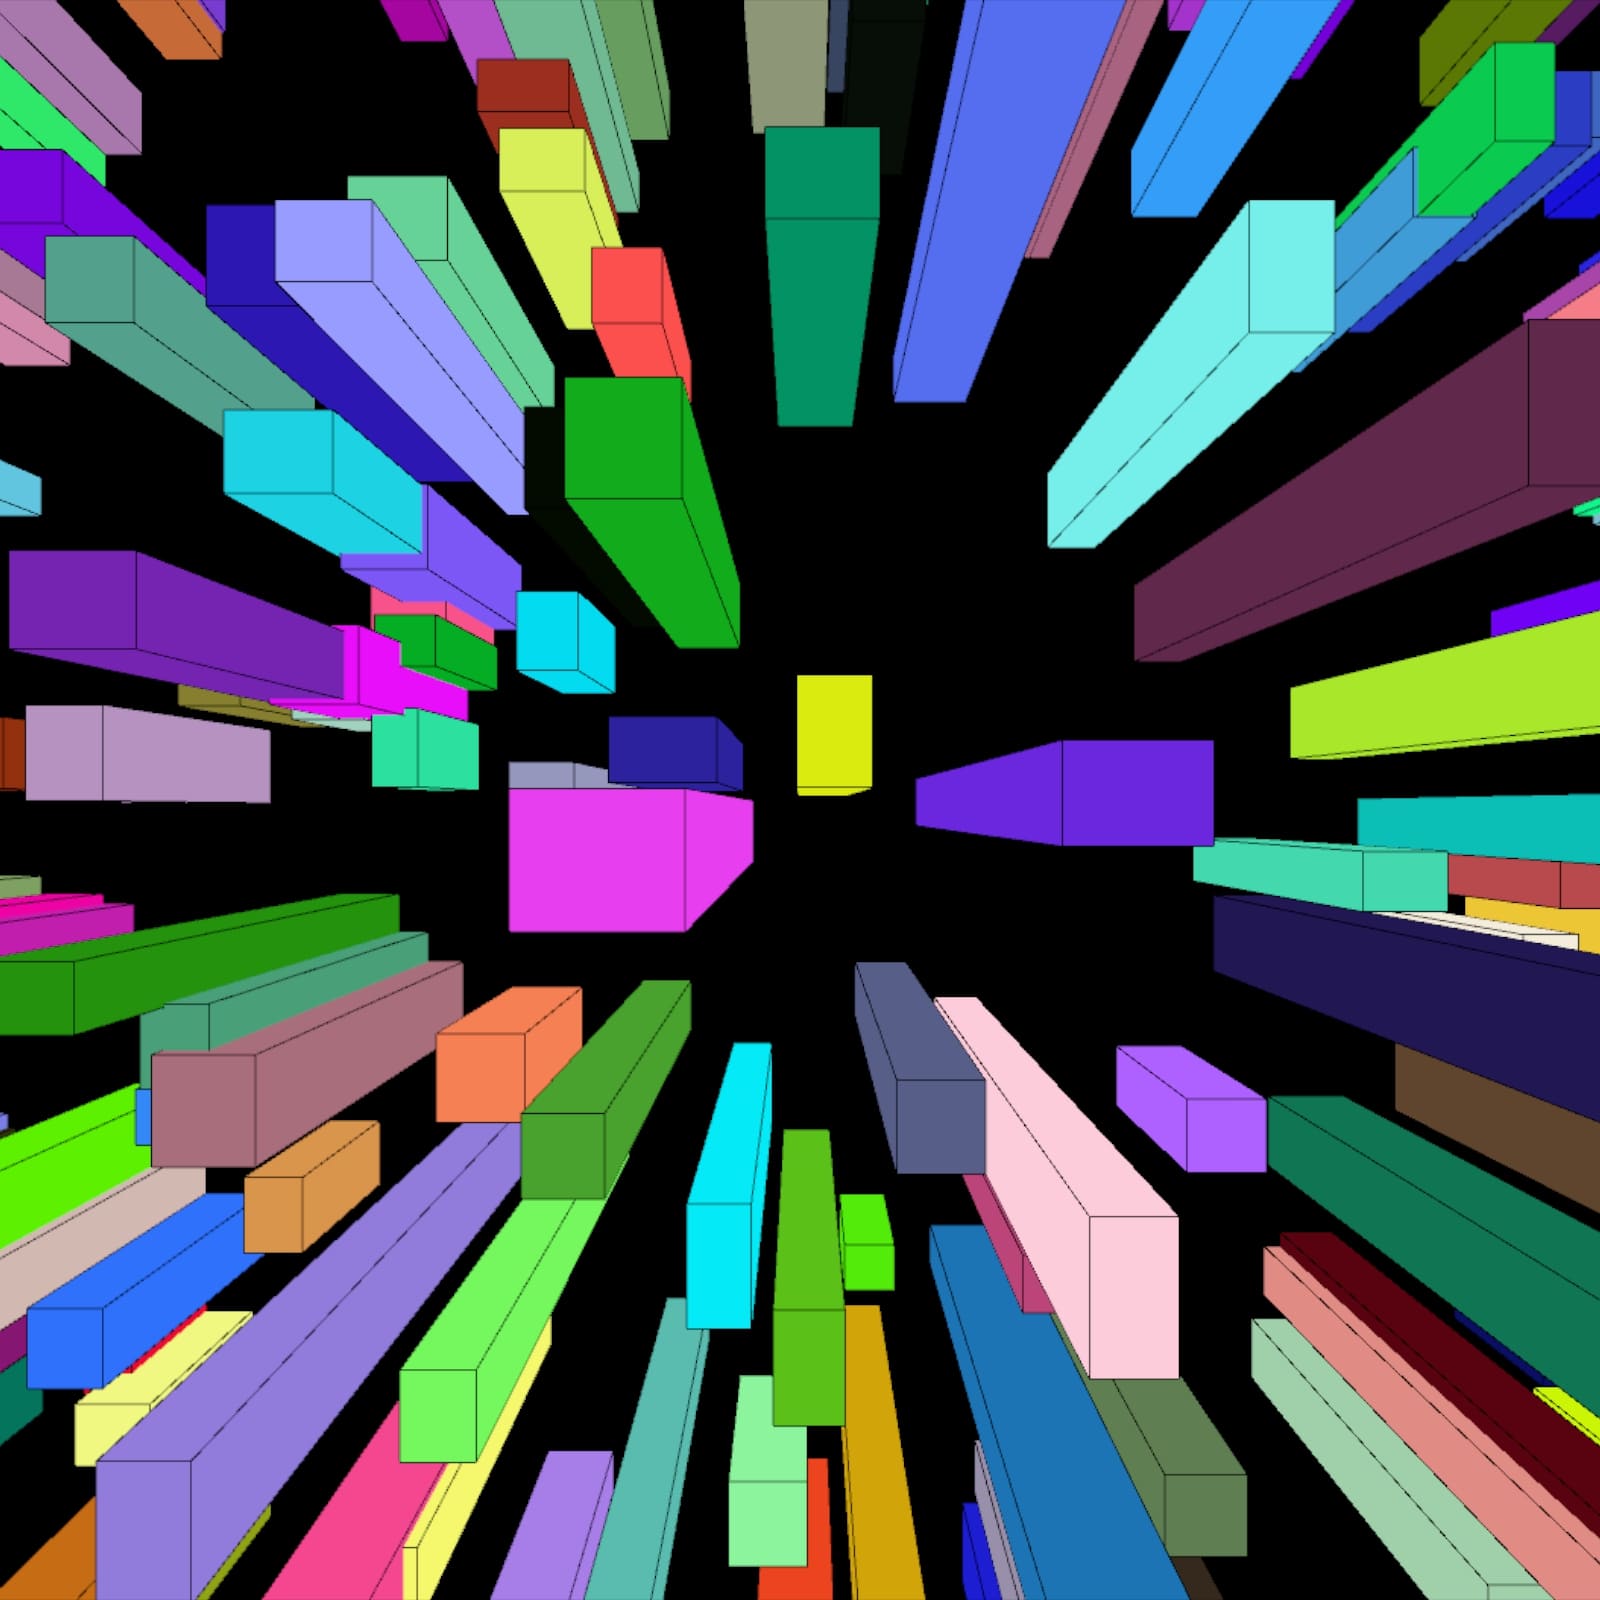
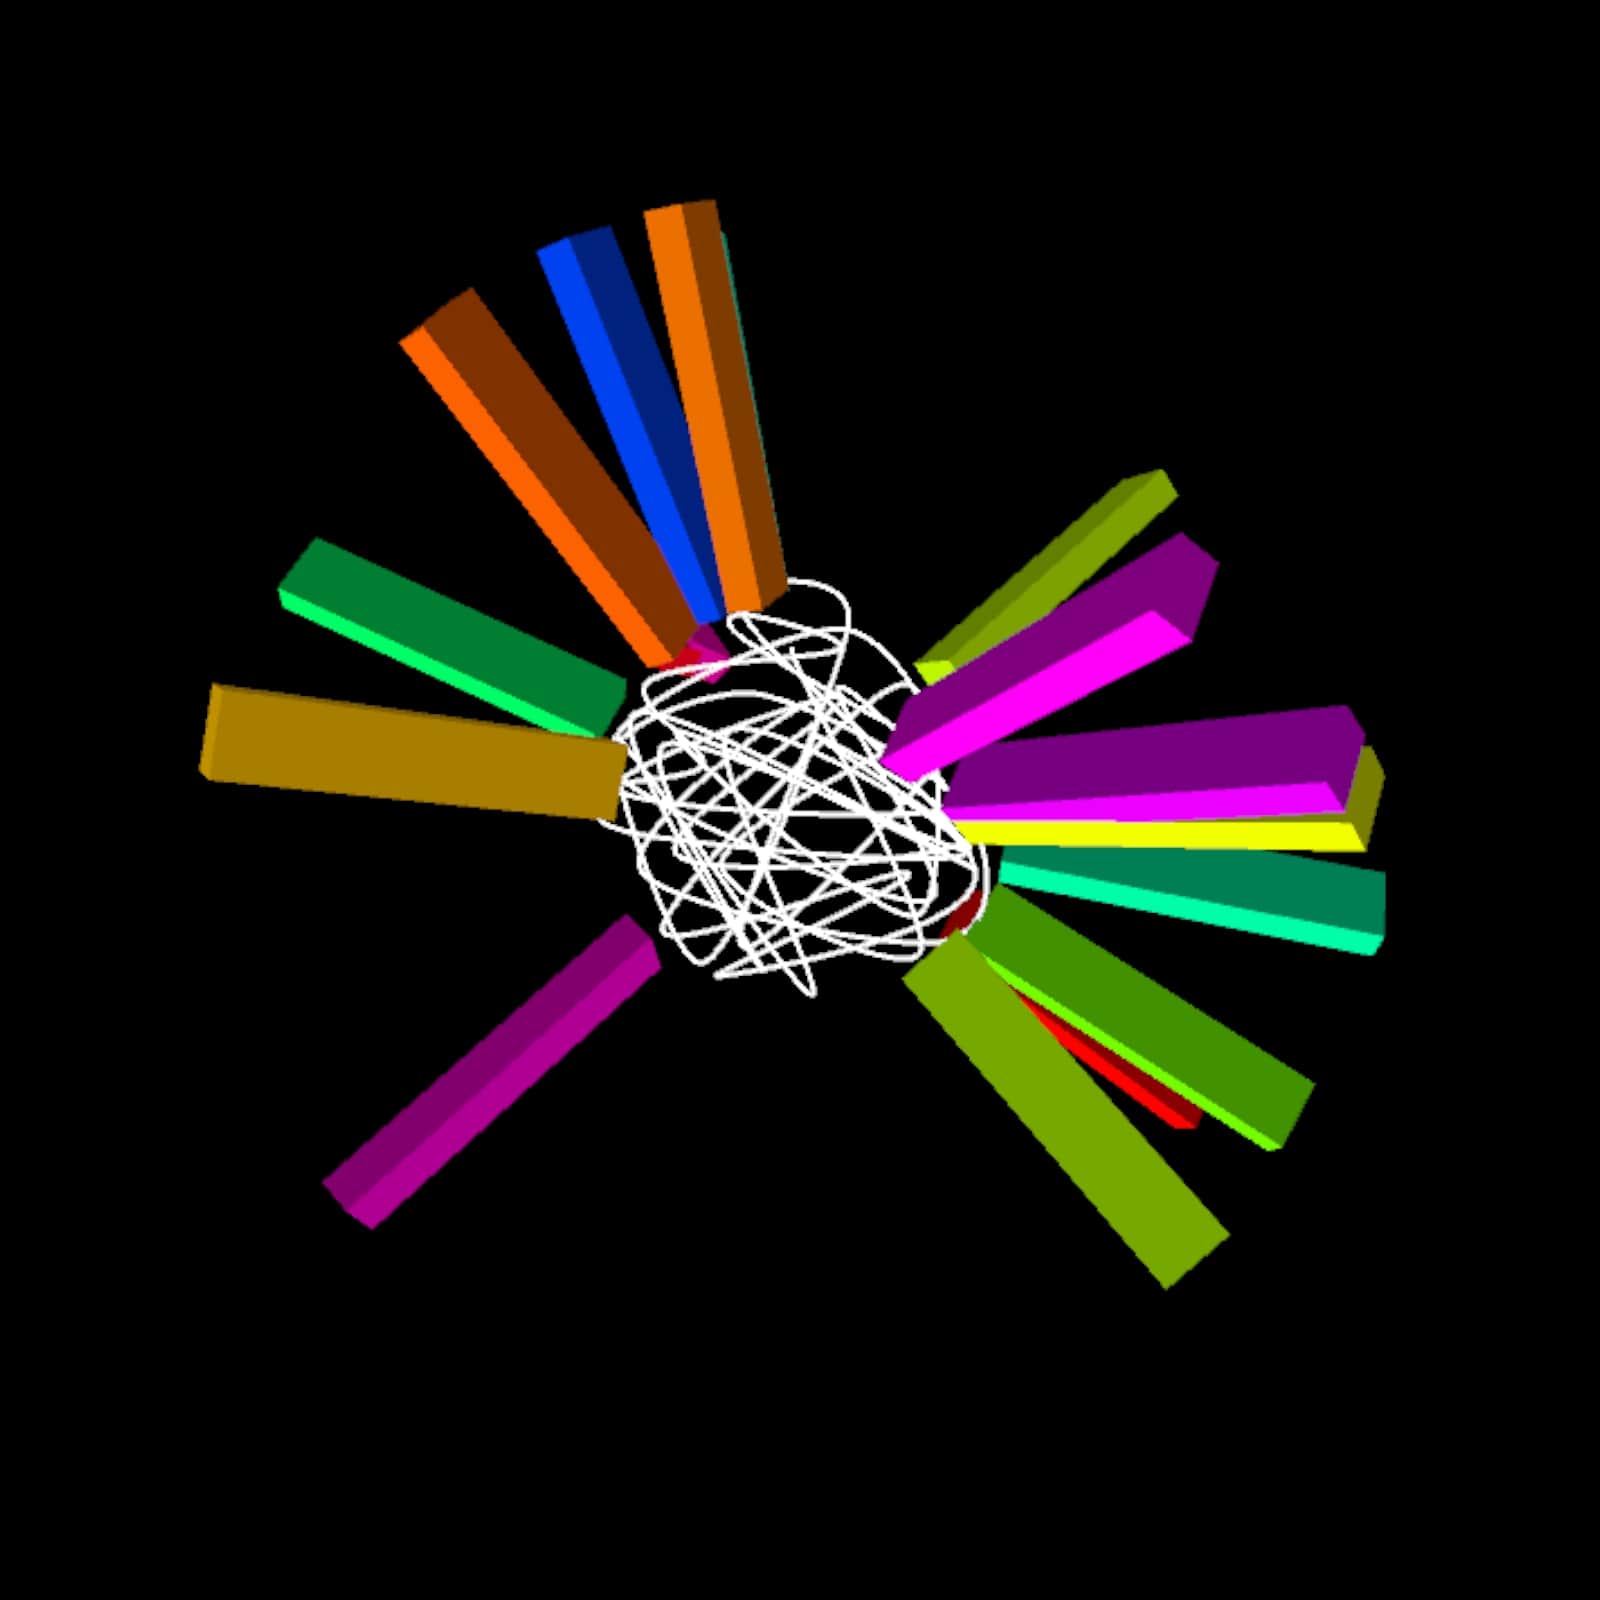
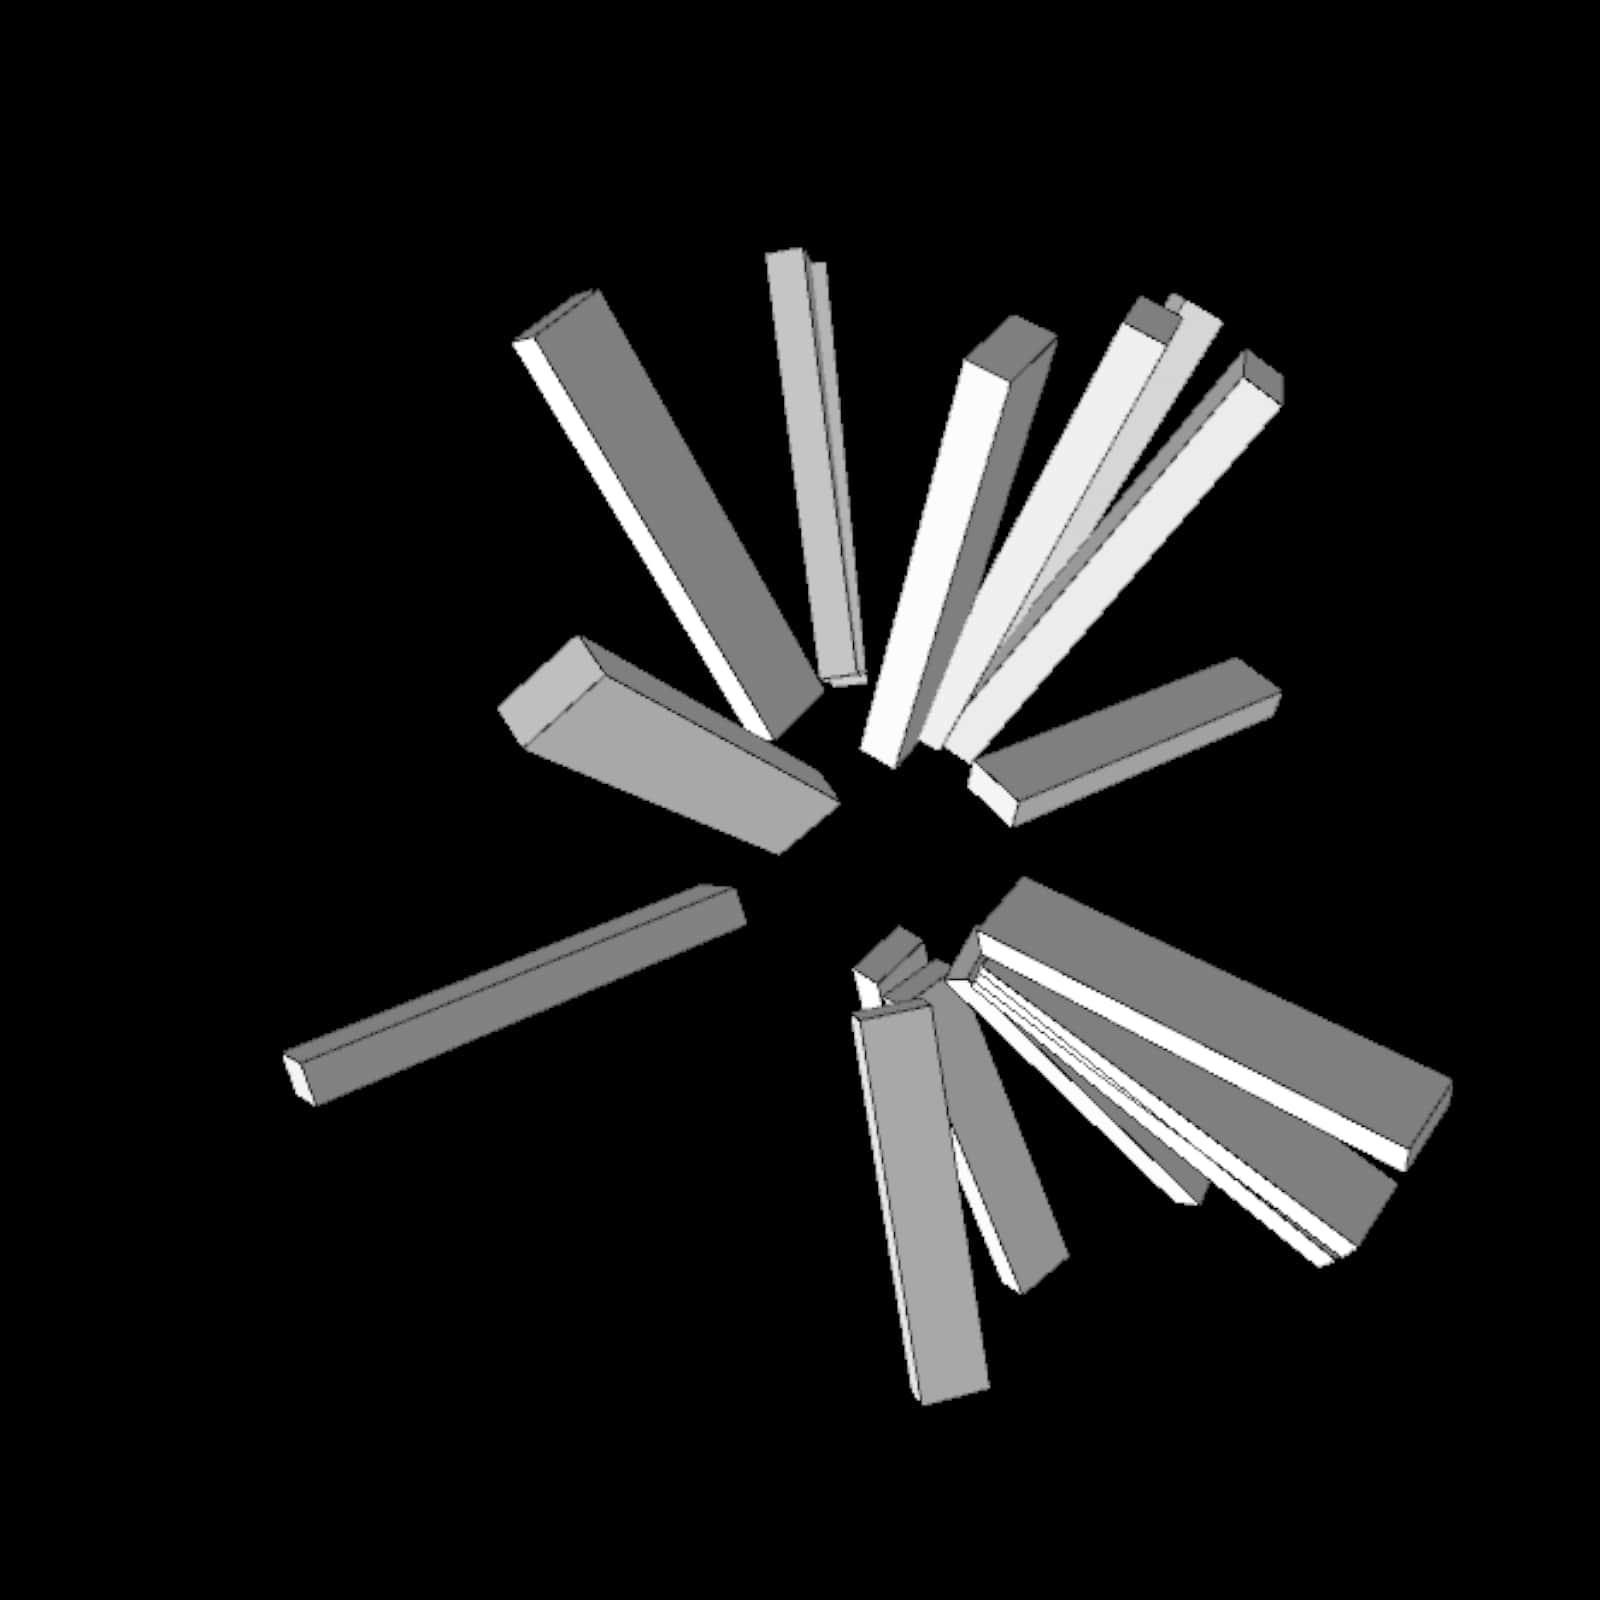
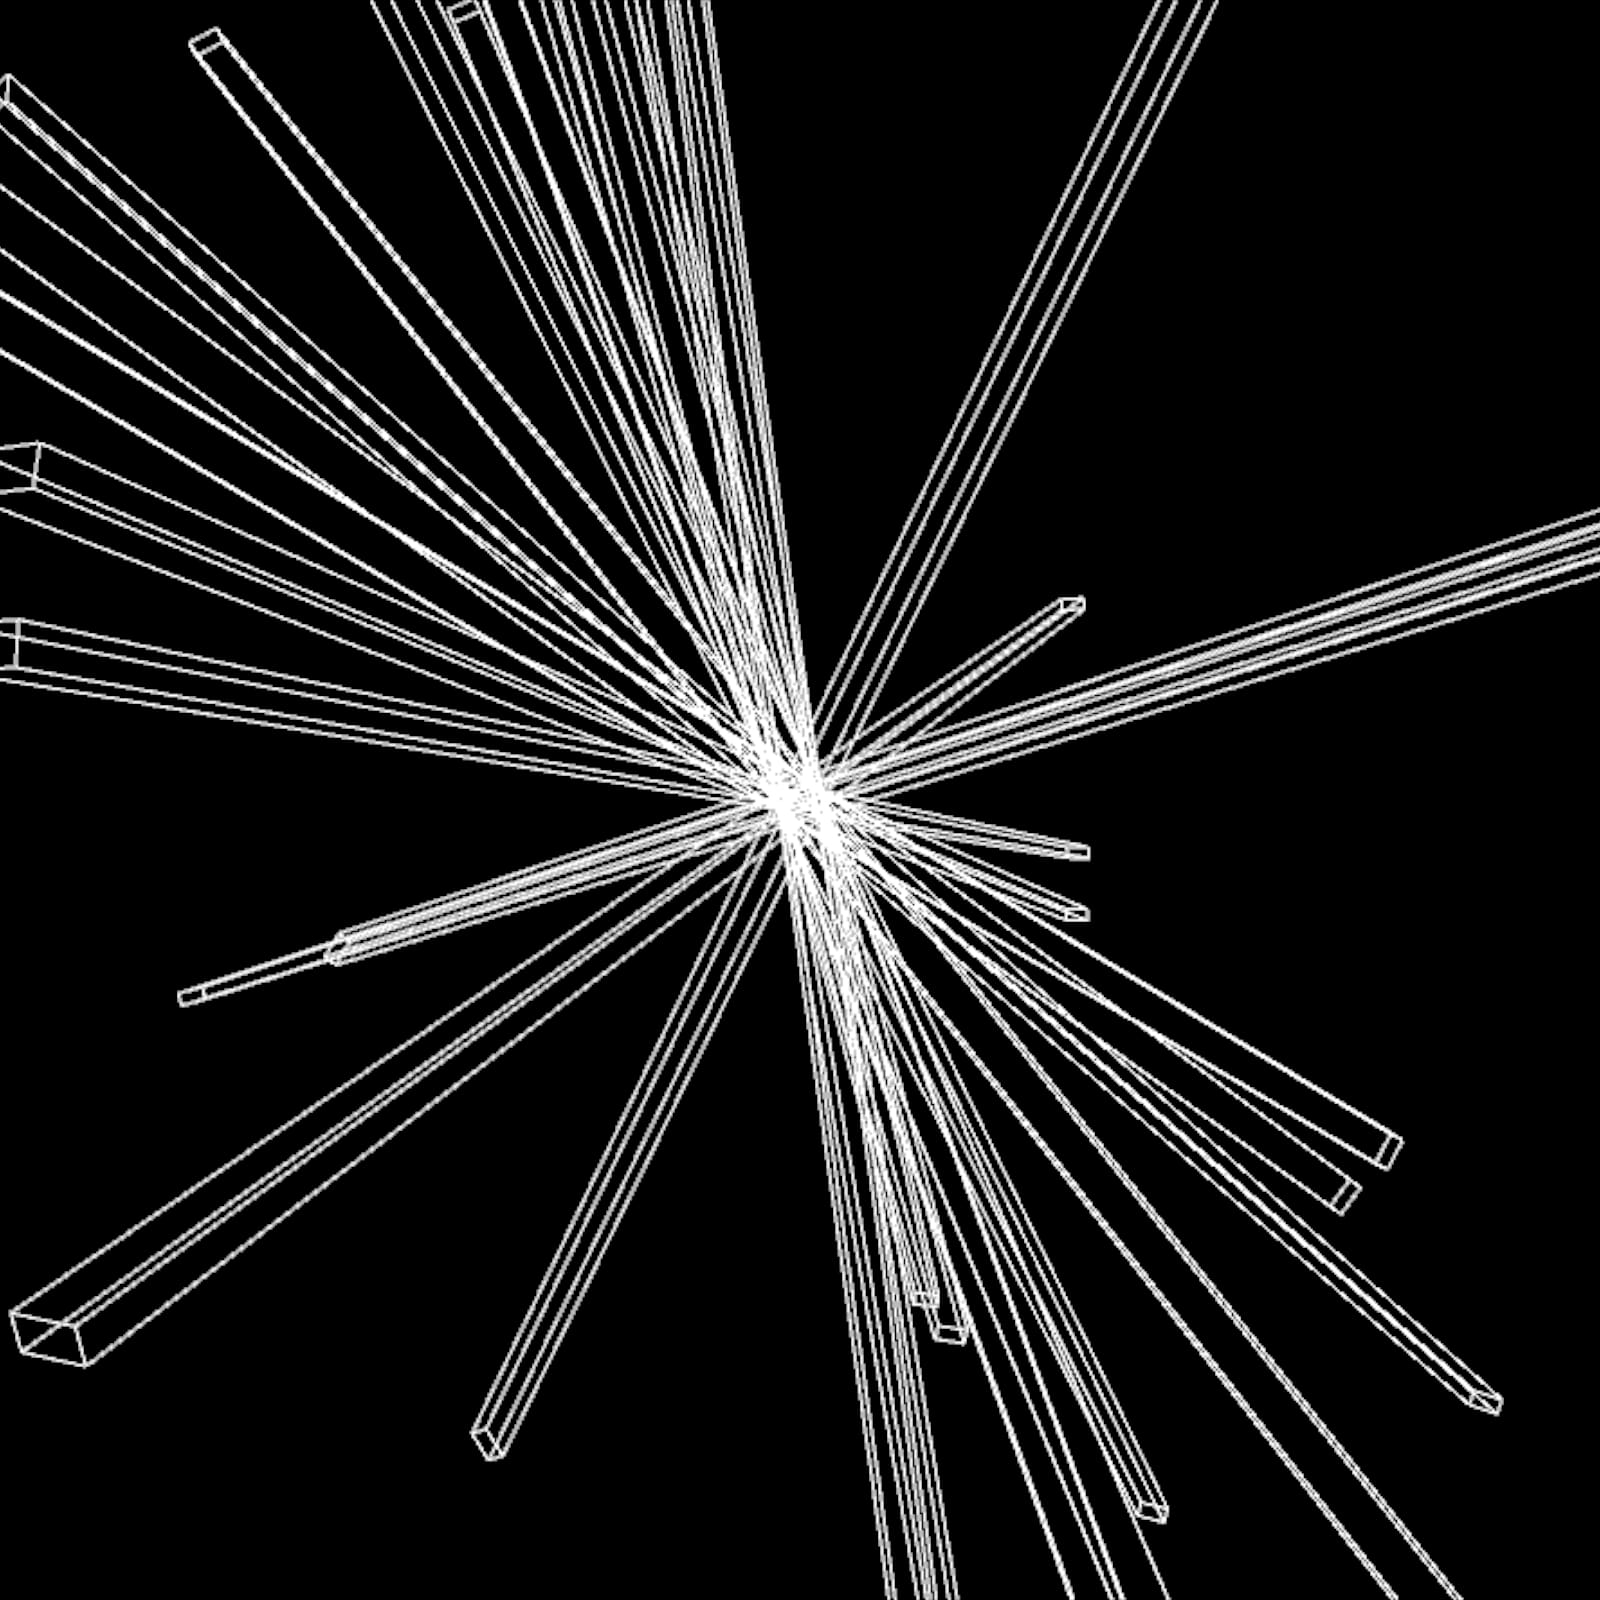
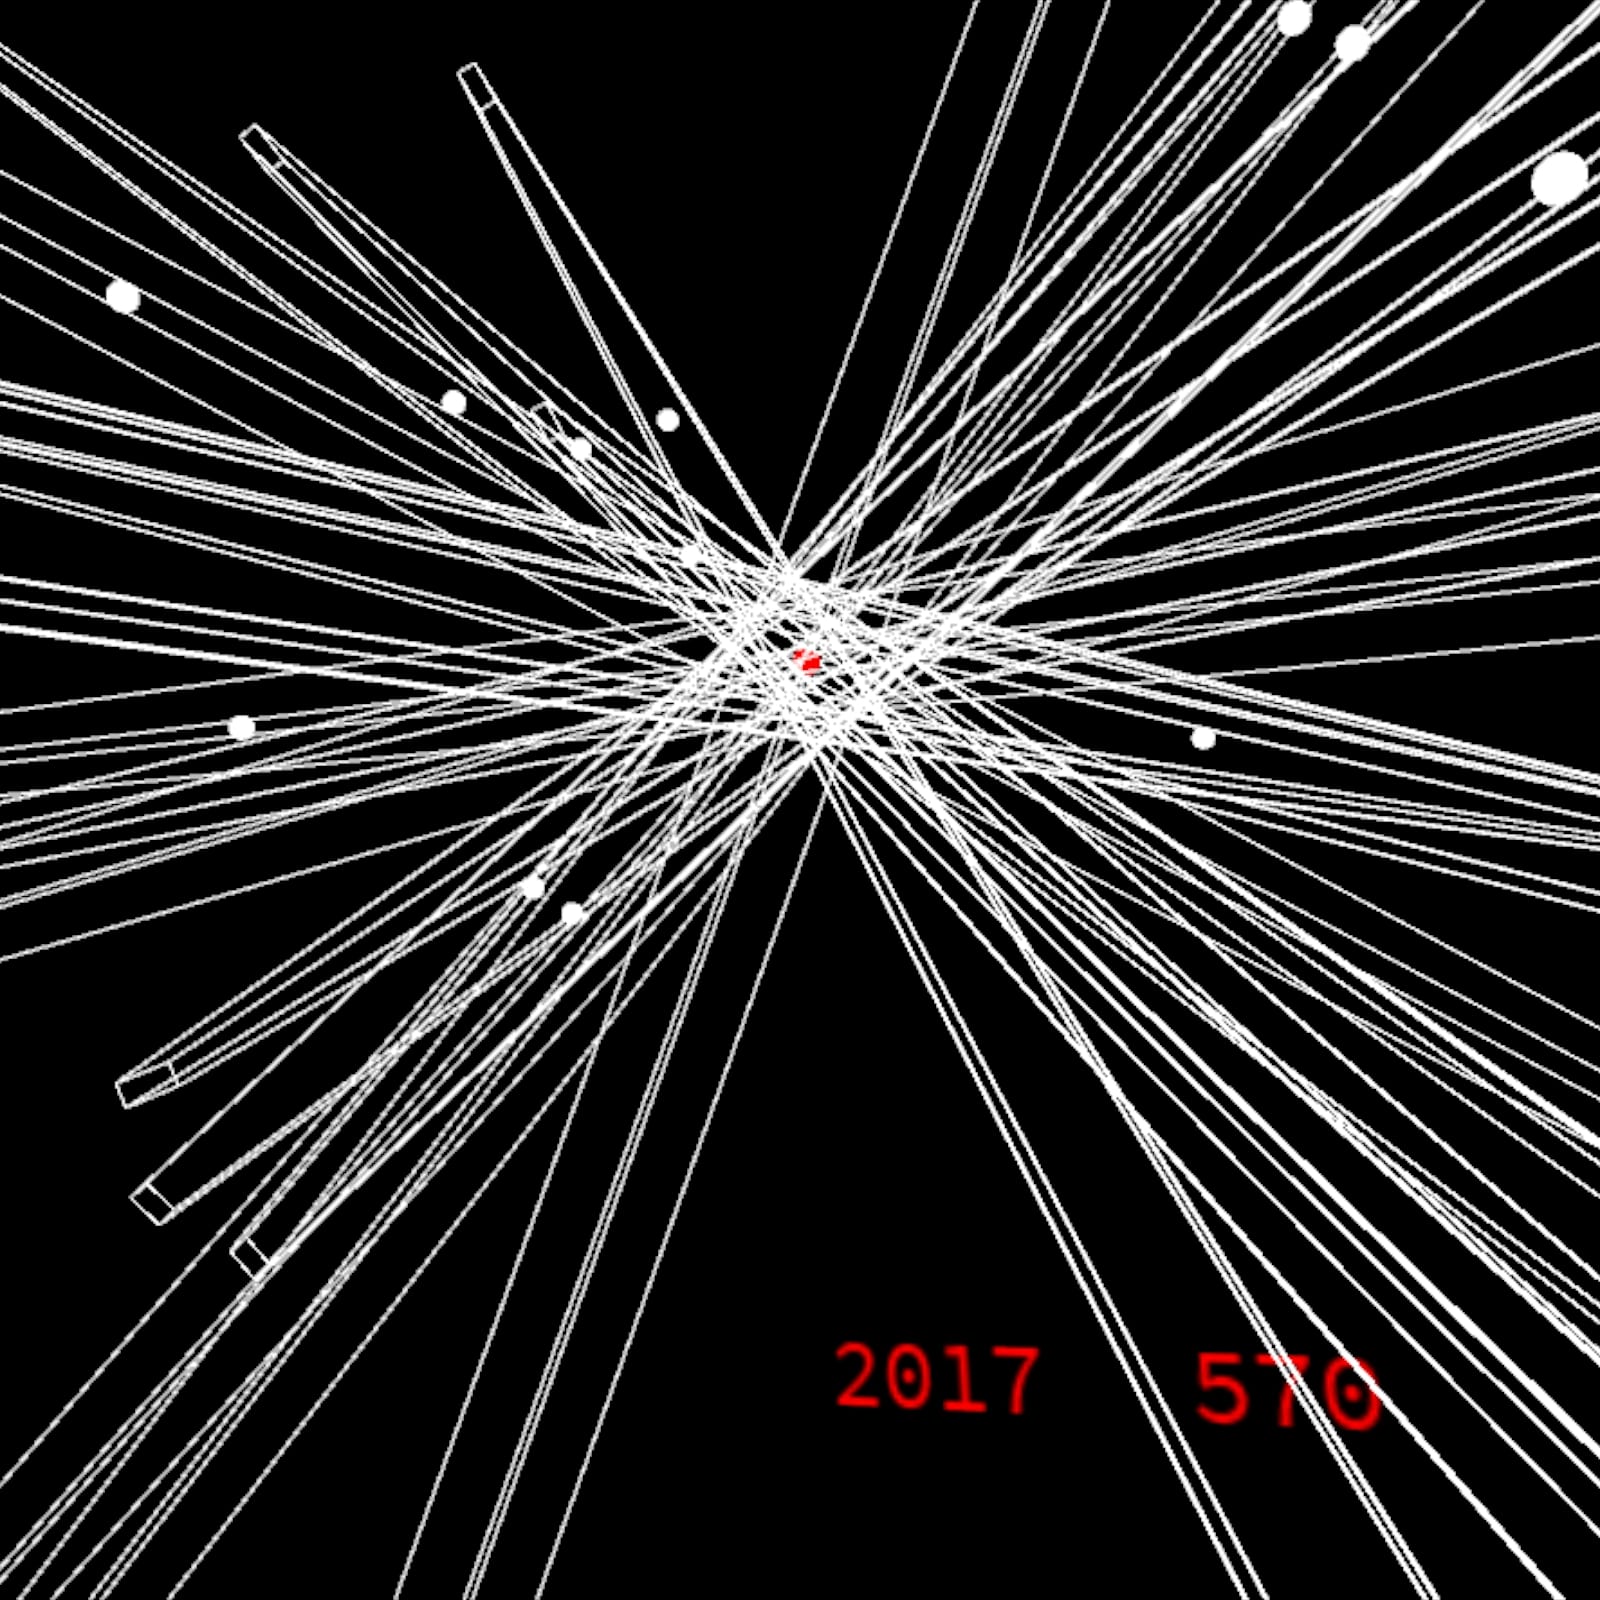
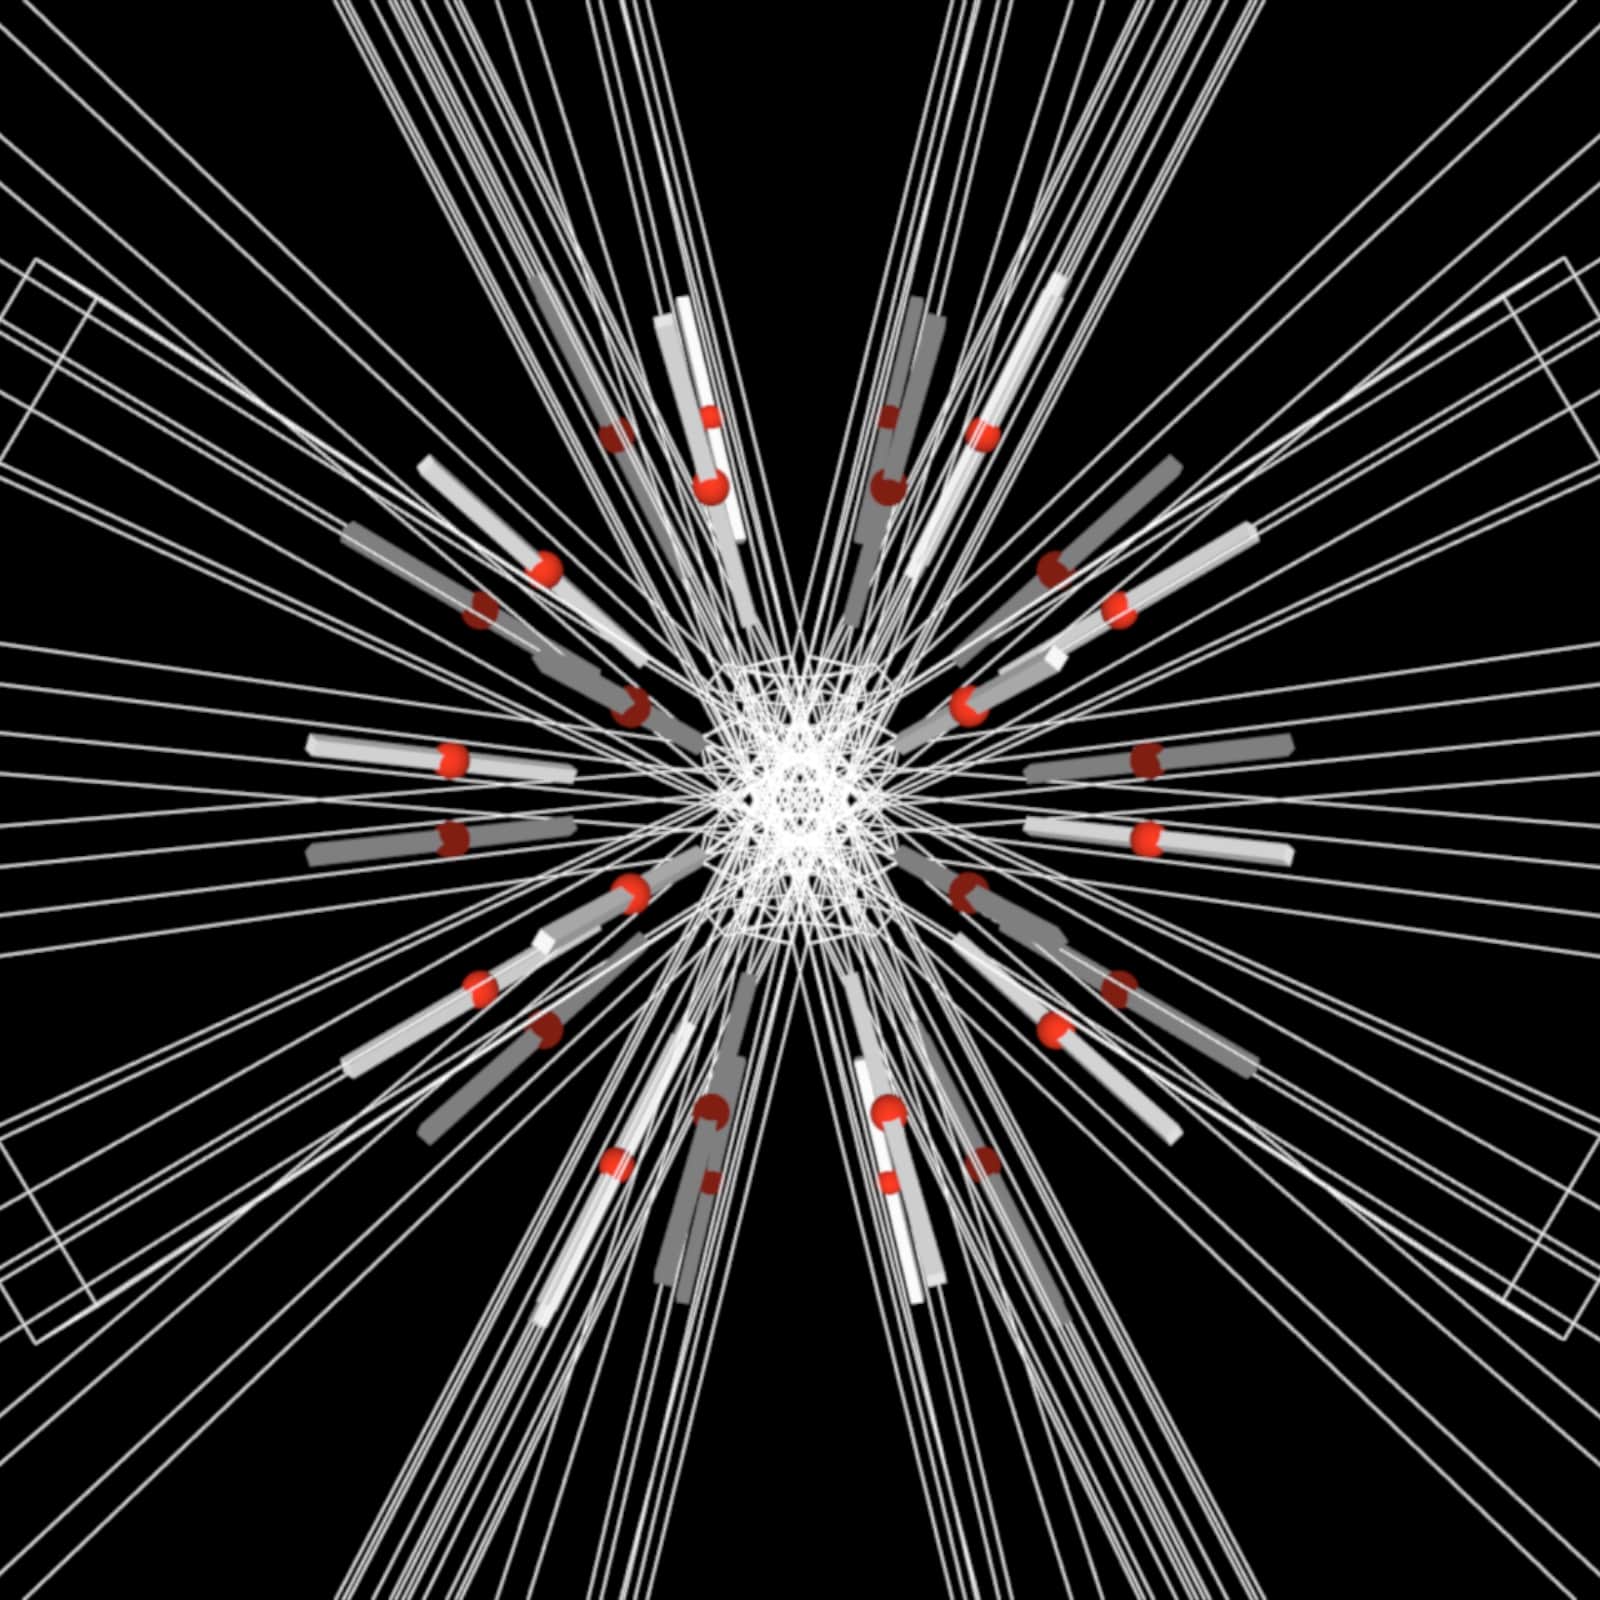
Urban Deterioration is a Processing visualisation that explores the widespread closure of London nightclubs. This has reduced employment within these areas and has arguably impacted the city’s culture in general. To map this issue, I wanted to create something aesthetically pleasing and engaging that transcends the affordances of a bar graph.
Concept and visual
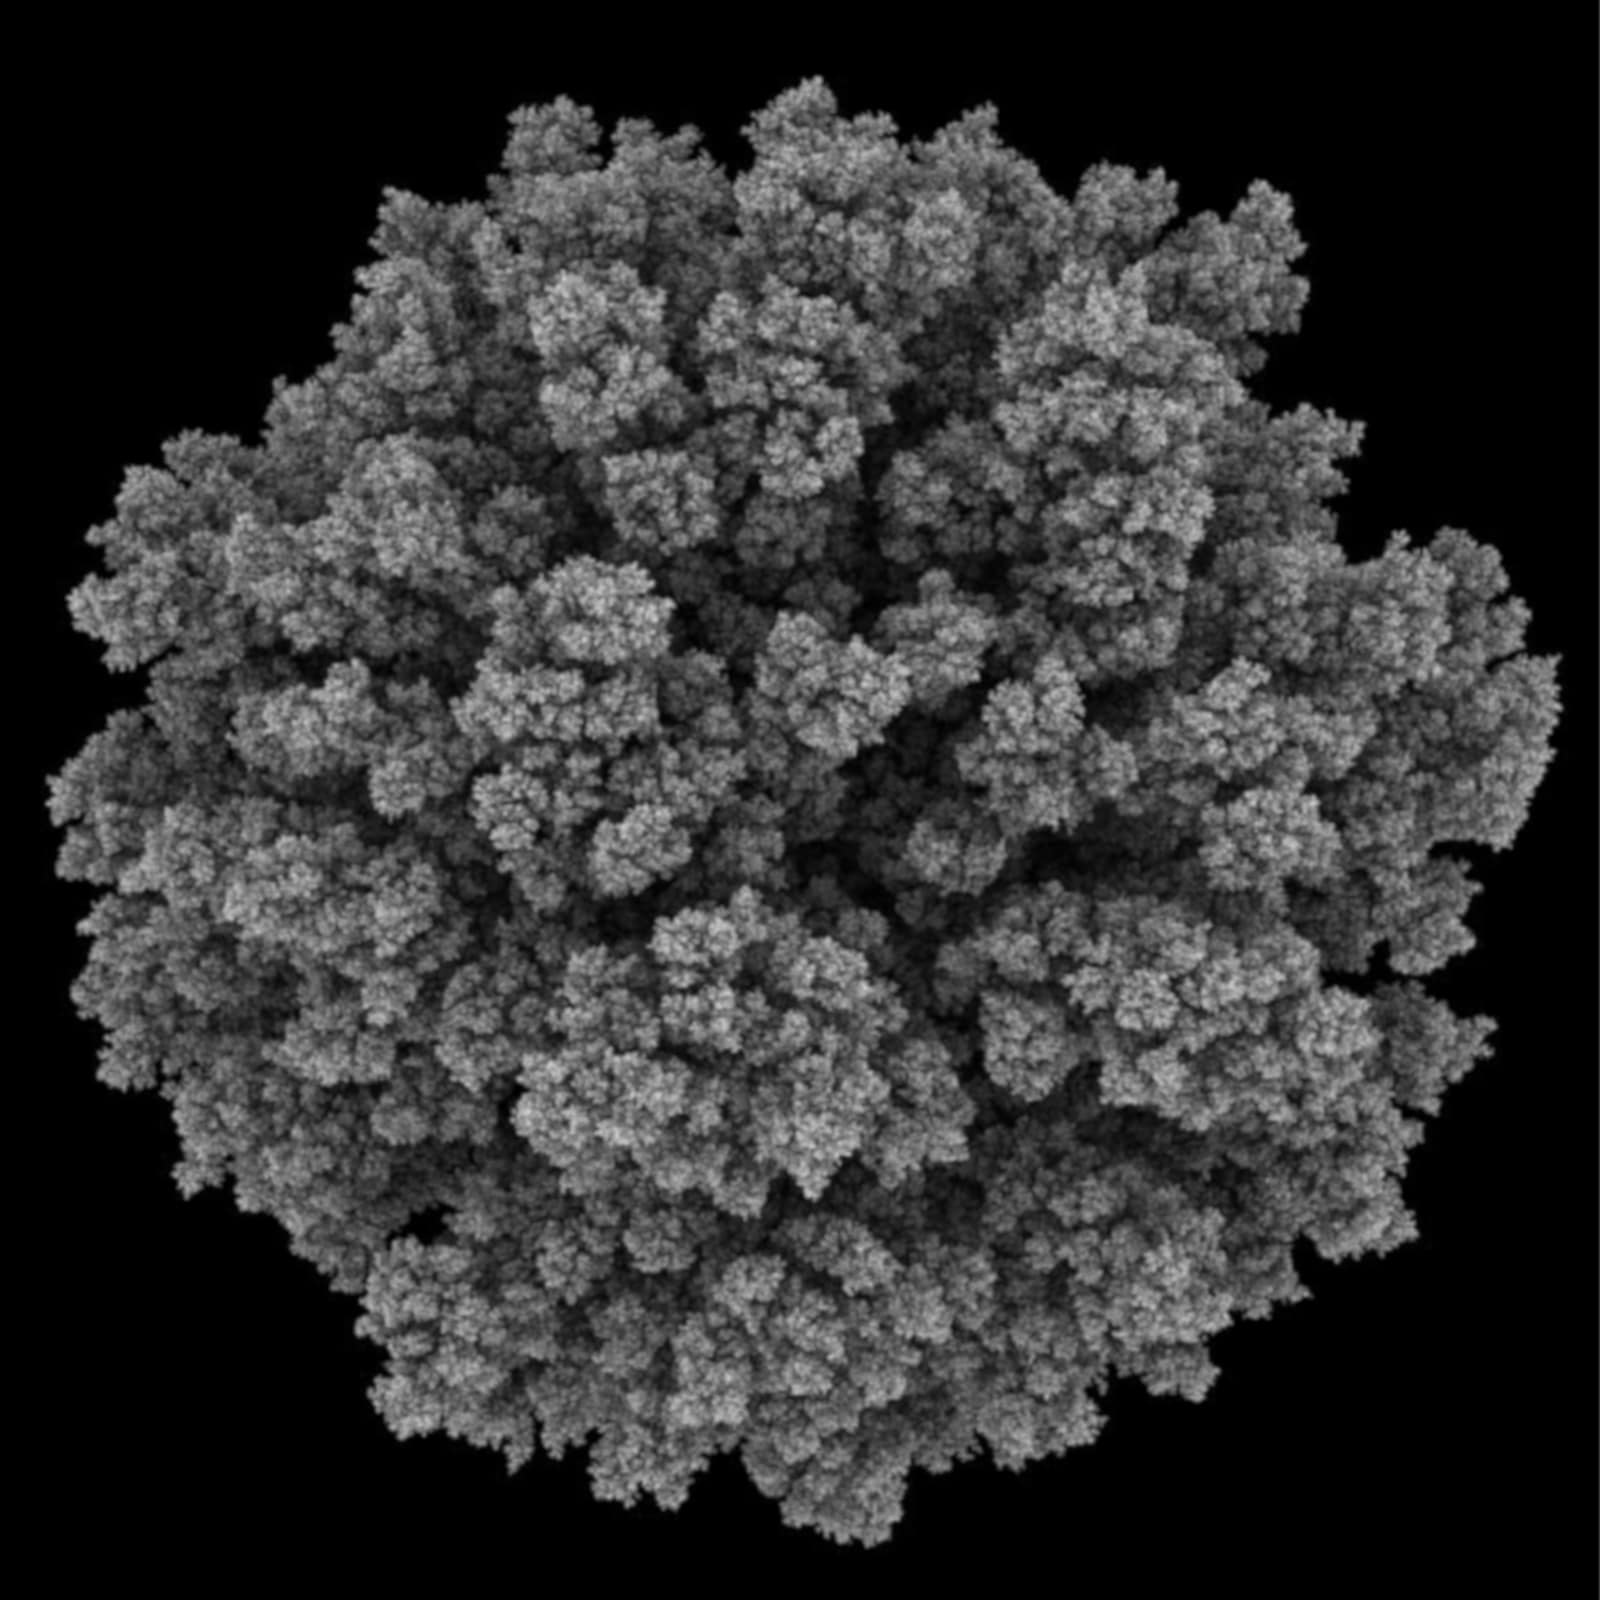
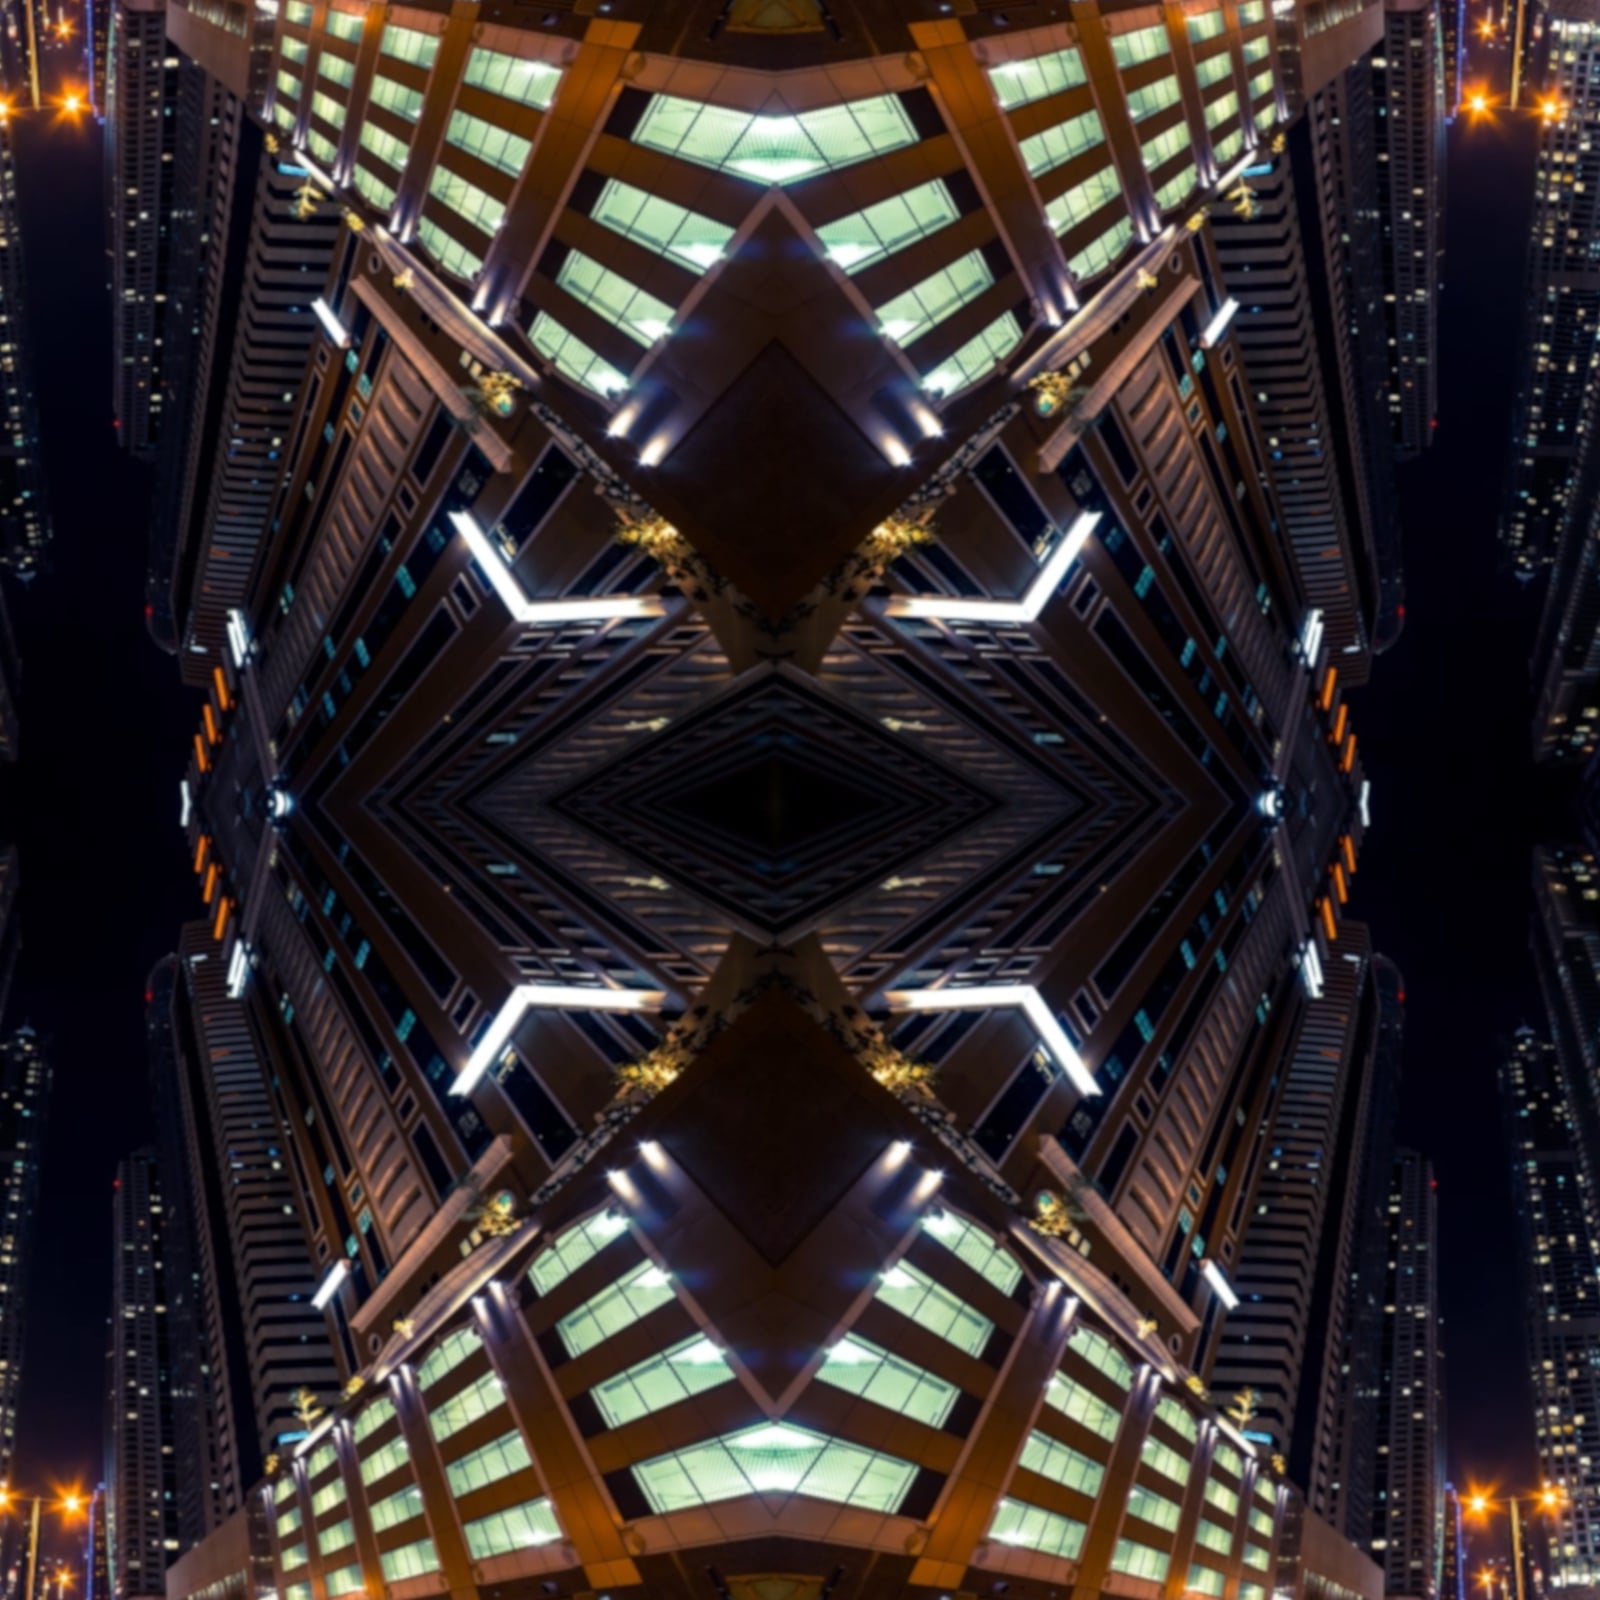
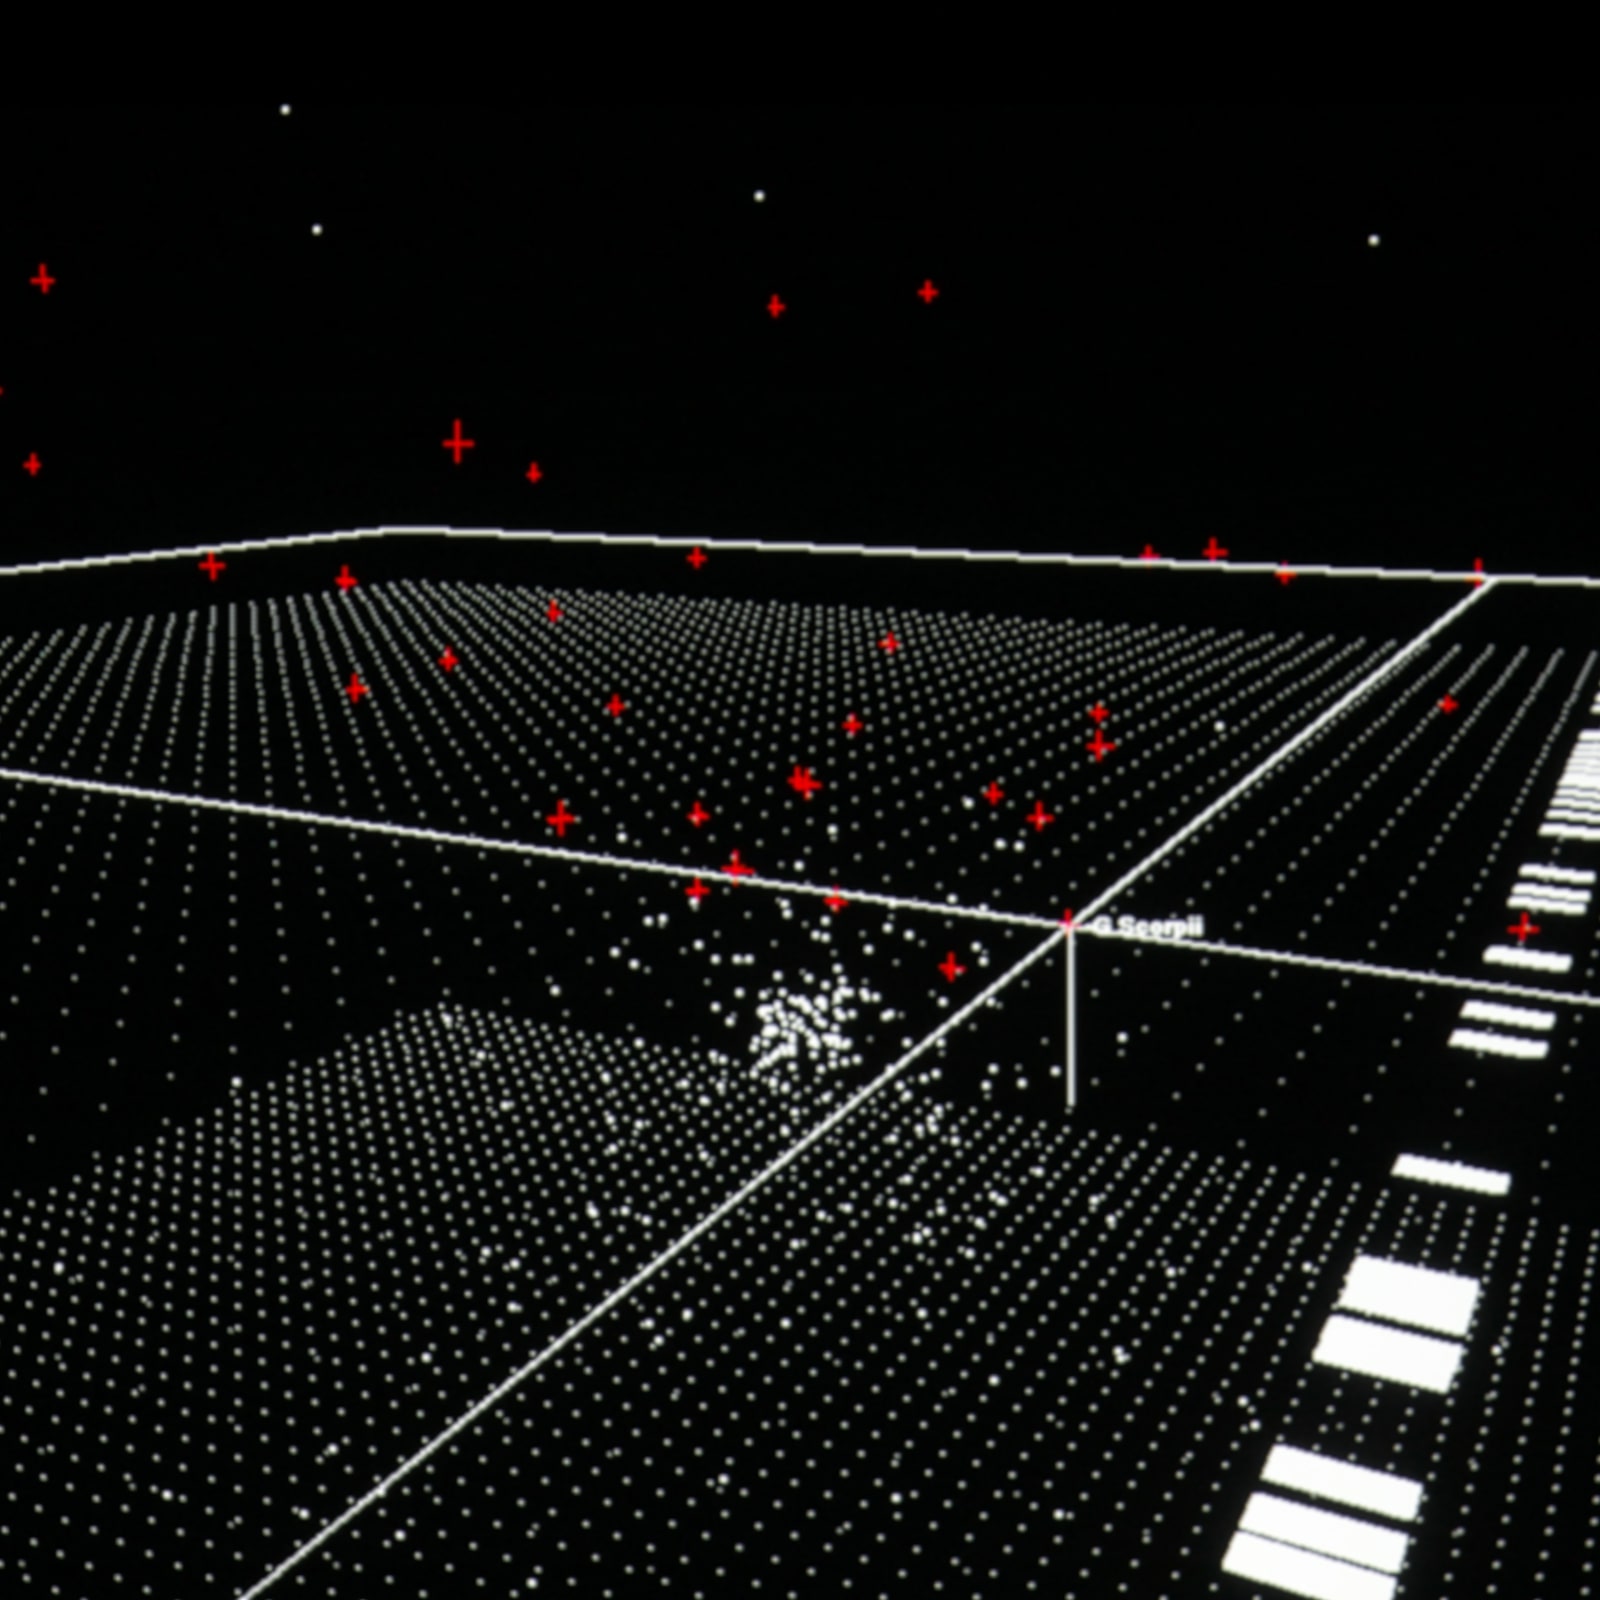
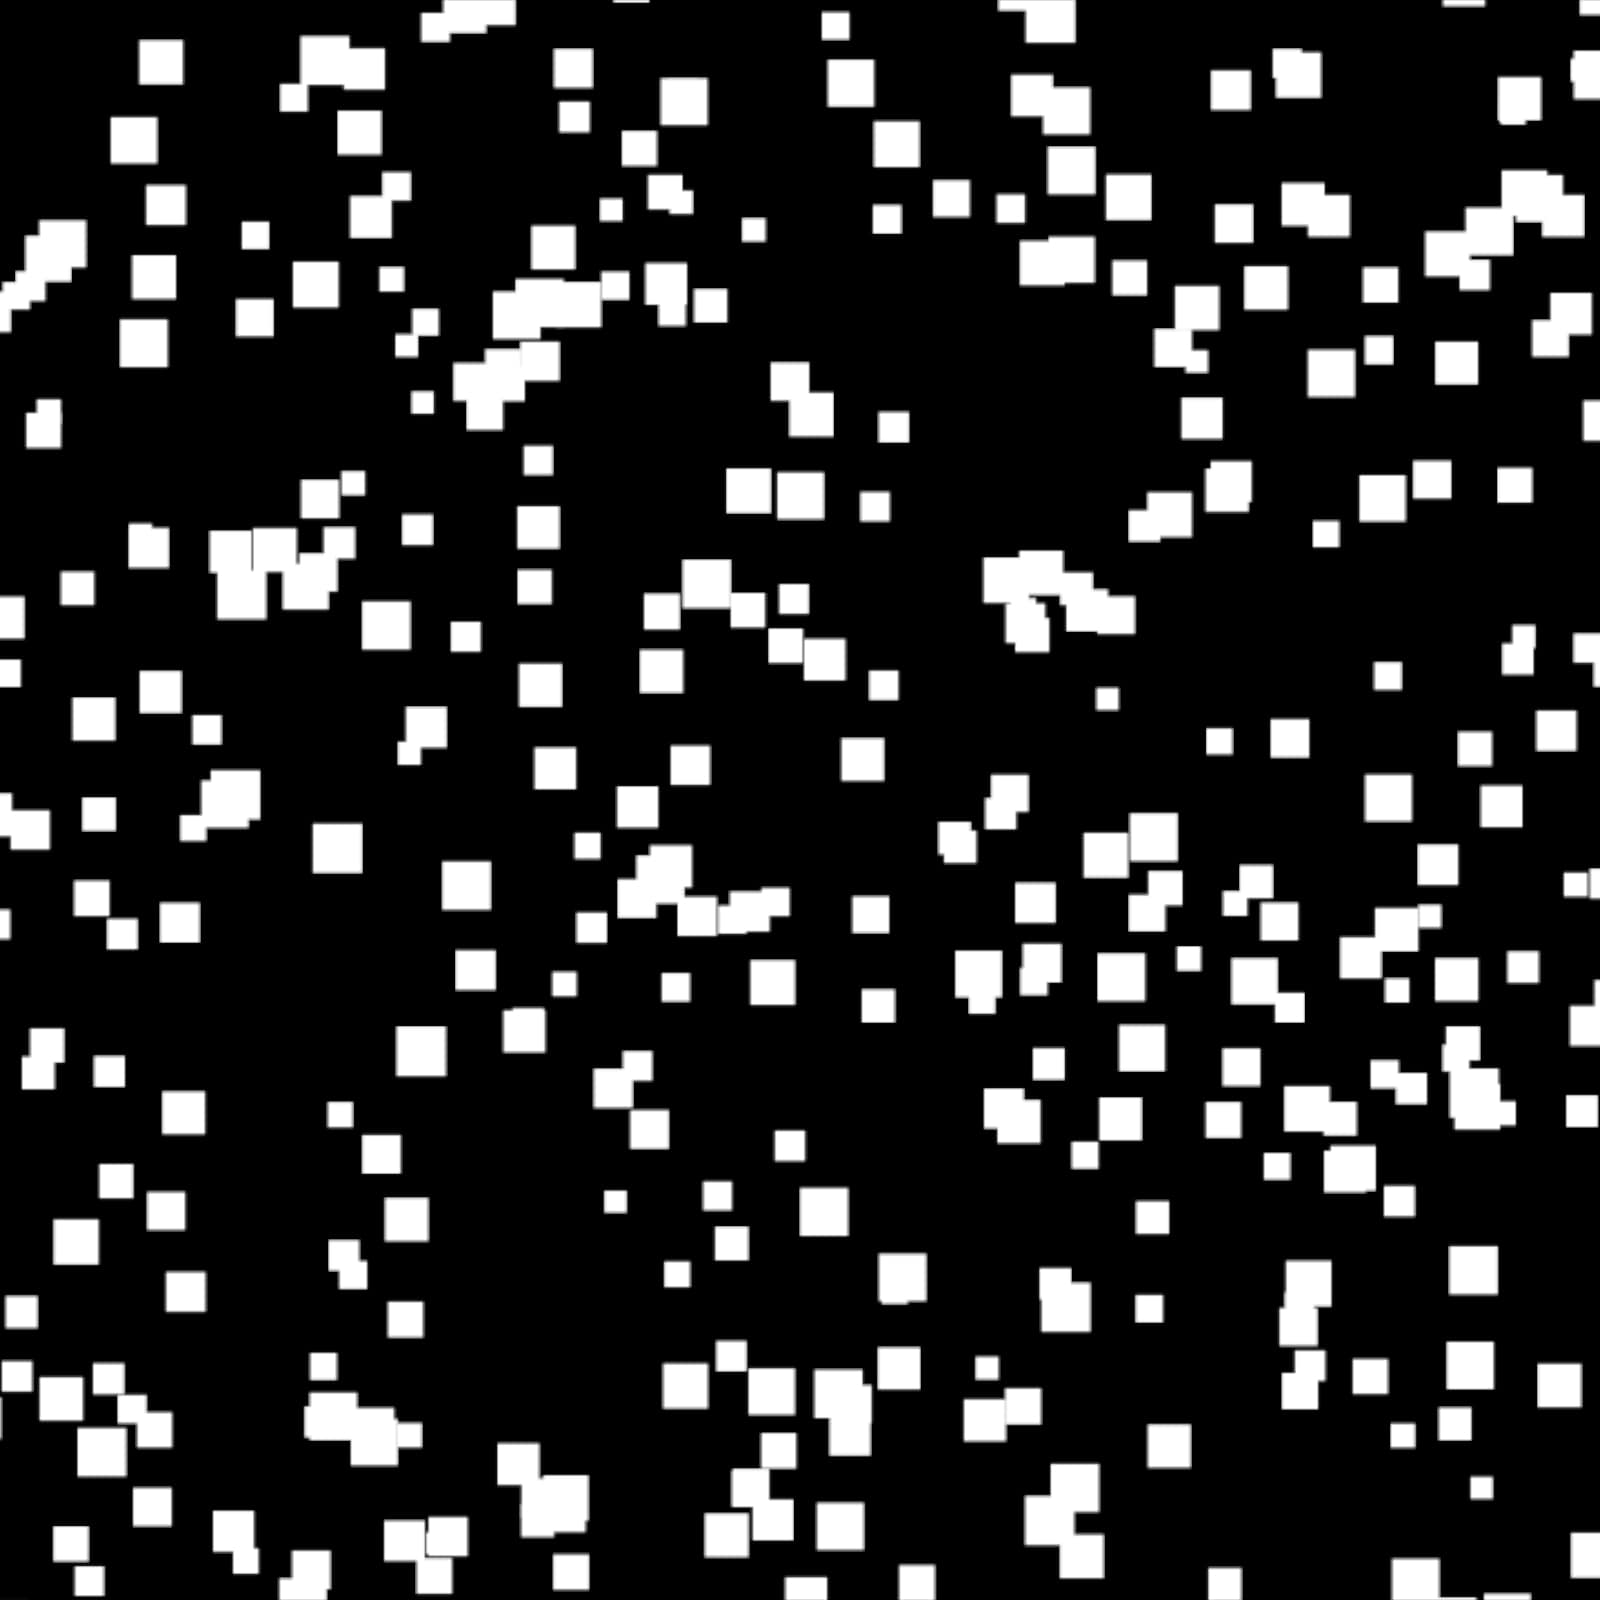
As always, the piece was inspired by a plethora of great work. My initial visual language was centred around biological processes such as crystal growth and chemical reactions. This brought me to Andy Lomas’ morphogenesis simulations and the emergent systems of Casey Reas’ Process Compendium. However, mimicking nature through code was a conceptual divergence from my story. The design eventually became architectural upon revisiting Inaudible Cities by Semiconductor. Further influence then came from Florian Rouzaud Cornabas’ kaleidoscopic time lapses. Compared to my monochrome sketches, this time around I subtly included colour to keep it distinct but consistent with previous work. Then finally, Ryoji Ikeda’s Datamatics project revitalised and cemented my choice for the overall aesthetic.
Technical
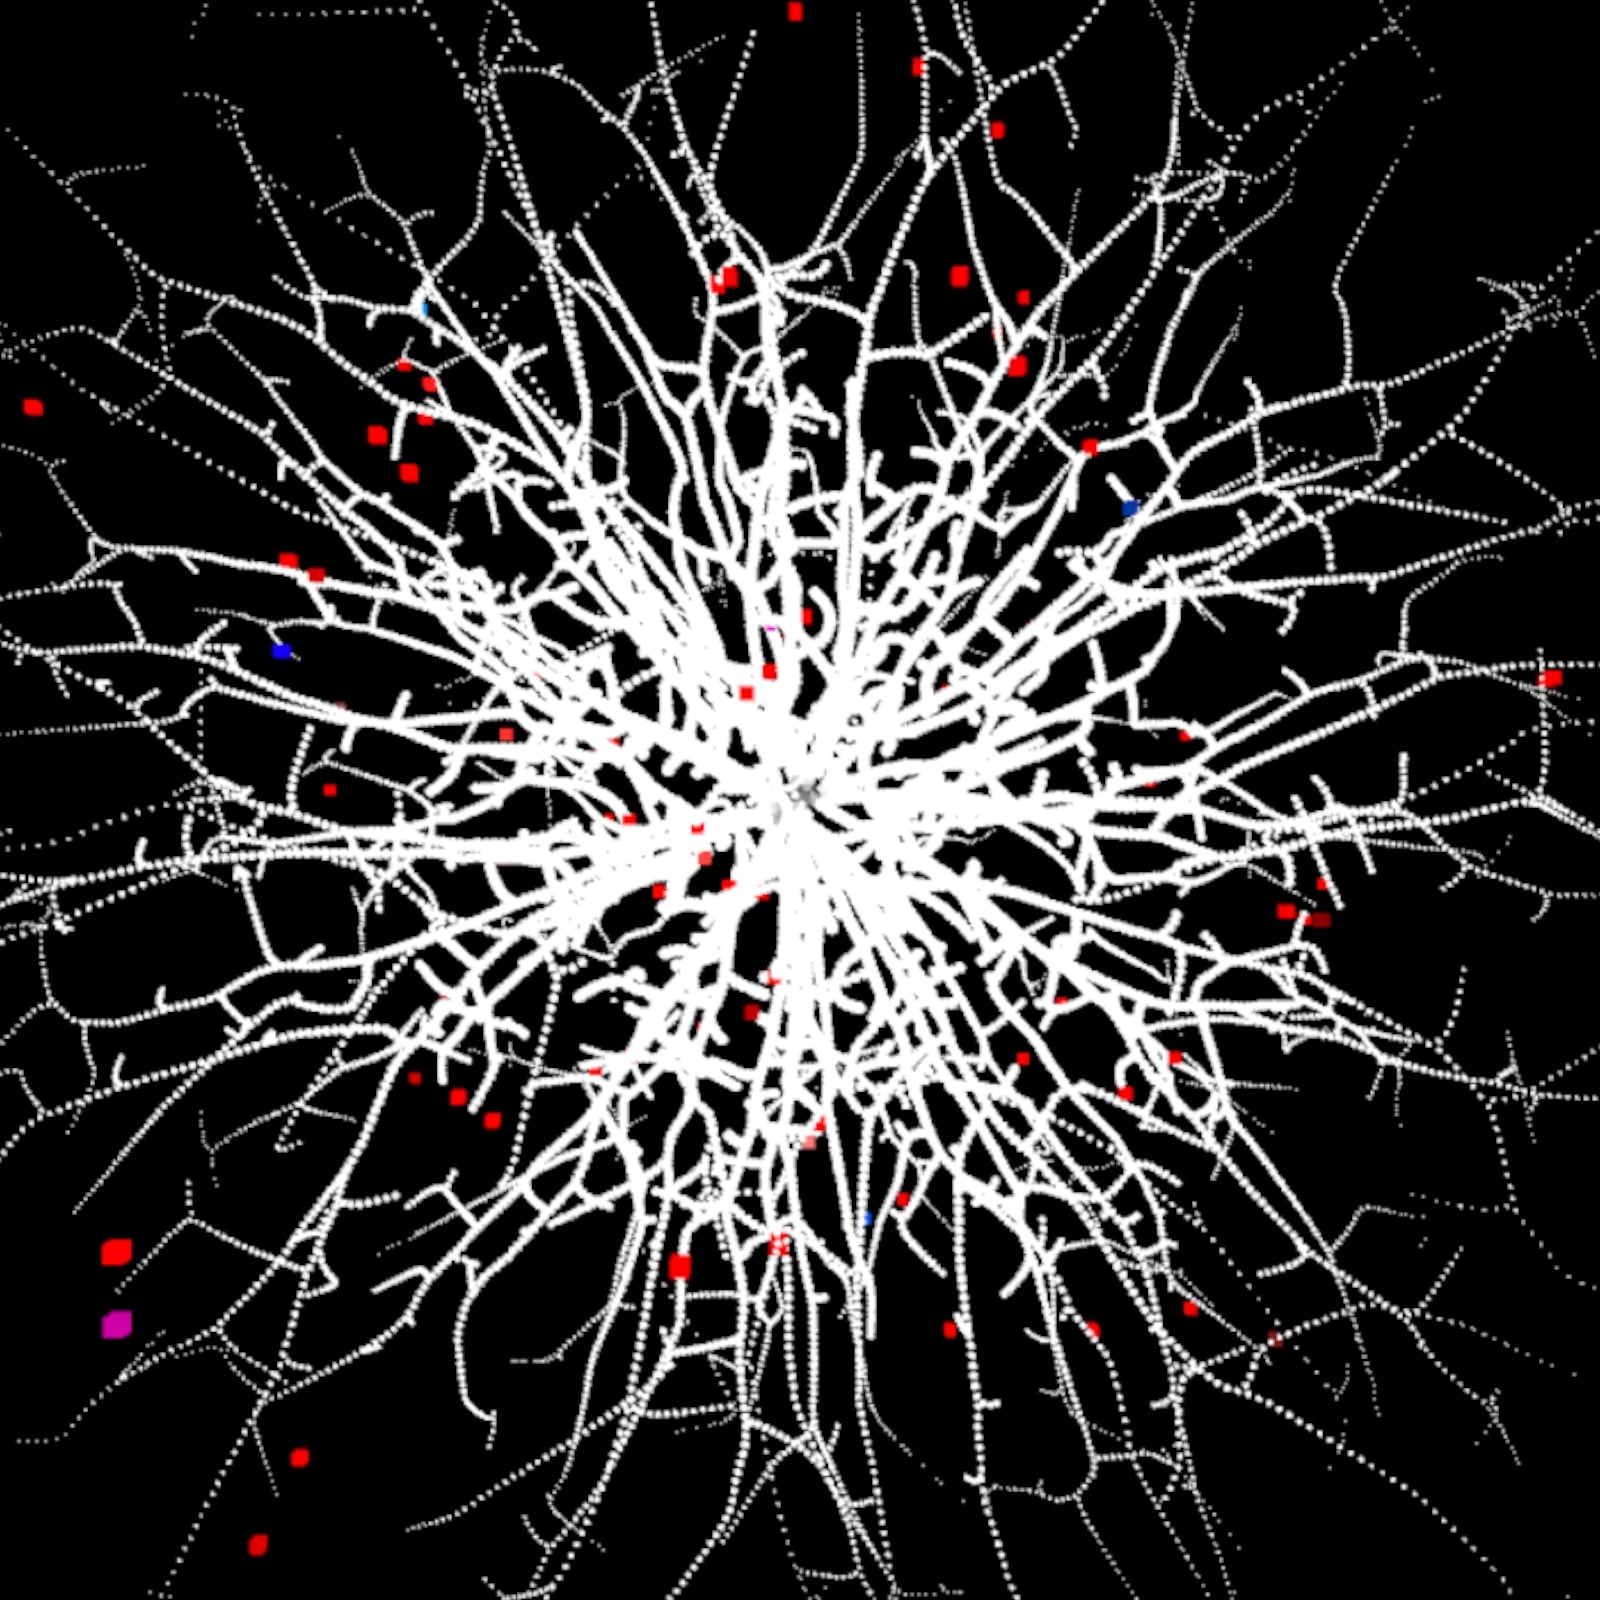
I ventured into the world of data visualisation to extend my technical skillset, but also dabbled with many other topics through the graphical development of this project. This included parametric equations, diffusion limited aggregation and space colonisation algorithms. But these methods thematically detracted from the core area of investigation. Obtaining the dataset was simple, the London Datastore contained statistics for the number of licensed clubs and employees in those workplaces from 2001 to 2017. These numbers were encapsulated into a comma separated value (CSV) file to simplify the debugging process. Object orientated programming allowed me to create a class which loops over parsed CSV data and store values within Processing’s Table object. Each table row cycles through incoming data which rotate the 3D primitives. For the boxes to spherically emanate, a Daniel Shiffman Coding Challenge showed me how to use a cross product vector to convert from cartesian to spherical coordinates. The mirrored canvas effect was also borrowed from Shiffman’s Brownian snowflake tutorial. For extra movement I also incorporated a recursive function to further abstract this visual approach.
Self evaluation and future development
Overall, I believe my visual story was successful, but the social commentary could be developed further. Despite alluding to these urban issues, I think the data could be refined for thematic density. For instance, each scene could signify a new year that deteriorates according to a space colonisation algorithm (representing gentrification). Or each London Borough have its own bespoke style and I could display each variation in series. With more time I would have also liked to incorporate audio sonification. After this project, I want to continue my graphics programming practise and incorporate some of the many new skills from this module. But I mostly intend to just keep on creating with code generally.
References
- Lima, A. & Davies, J. (2017). The clubbing map: What has happened to London nightlife? Nesta, (online) Available at https://www.nesta.org.uk/blog/the-clubbing-map-what-has-happened-to-london-nightlife/ (Accessed: December 2018).
- Lomas, A n.d., Aggregation, Available at http://www.andylomas.com/aggregationImages.html (Accessed: December 2018).
- Reas, C., (2010). Process Compendium 2004-2010. REAS Studio.
- Jarman, R. & Gerhardt, J. (2002). Inaudible Cities, Semiconductor Films, Available at http://semiconductorfilms.com/art/inaudible-cities/ (Accessed: December 2018).
- Rosenthal, E. (2015). Behold, the Modern Machine, Vice, (online) Available at https://www.vice.com/en_uk/article/d74w9z/behold-the-modern-machine (Accessed: December 2018).
- Ikeda, R. (2006). Datamatics, Available at http://www.ryojiikeda.com/project/datamatics/ (Accessed: December 2018).
- Shiffman, D. (2015). Learning processing : A beginner's guide to programming images, animation, and interaction (Second ed.).
- Terzidis, Kostas. (2009). Algorithms for Visual Design Using the Processing Language. John Wiley & Sons.
- London Datastore, Greater London Authority, 2018 (online) https://data.london.gov.uk/dataset/pubs-clubs-restaurants-takeaways-borough (Accessed: December 2018).
- ‘Spherical coordinate system’ (2018) Wikipedia. Available at https://en.wikipedia.org/wiki/Spherical_coordinate_system (Accessed: December 2018).
- ‘Quaternions and spatial rotation’ (2018) Wikipedia. Available at https://en.wikipedia.org/wiki/Quaternions_and_spatial_rotation (Accessed: December 2018).
- Shiffman. Daniel, Coding Challenge #58: 3D Earthquake Data Visualization, (2018), GitHub repository, https://github.com/CodingTrain/website/tree/master/CodingChallenges/CC_058_EarthQuakeViz3D/Processing/CC_058_EarthQuakeViz3D
- Shiffman. Daniel, Coding Challenge #127: Brownian Tree Snowflake, (2018), GitHub repository, https://github.com/CodingTrain/website/tree/master/CodingChallenges/CC_127_Snowflake_Brownian