


Data Characters
Anna Alfut
Selected creatures
We live in societies that exist in both visible and non-visible.1 At the intersection of physical and software worlds flow the undercurrents of data that embodies our interaction with the digital systems and logs information about our realities. Cloud as a metaphor has become an ‘everyday companion’ in conversations about computing. Niederer and Tauding Chabot call it an optimistic symbol of ‘technological promise’2. This nebulous metaphor morphs into a variant of Le Guin’s ‘carrier bag’ of everyday storytelling3, one that it is made largely of data and processes. Our heads are 'in' it, but we have no way of experiencing it's doings, other than through software.
Data is talked to be a resource. Resource not only of facts, but also stories created around them. Generative storytelling is a ‘paradigm shift’ for knowledge creation.4 While Kyong Chung asks if software was always there1, Niederer and Tauding question if the stories are pre-existing in the data, or are they added by the narrators. They argue that the story structures are not new, even if the process of writing has changed4. The shapes of stories are universal and, as Kurt Vonnegut humorously said, can be fed to a computer.5 Through application of NLP technologies these type of stories are now told in human readable language, which makes abstract information sets relatable.4 Lupi and Posavec, authors of Dear Data project6 spent a year manually plotting personal data memories. Their visual language, so different to the typical vocabulary of graphs and charts, changes the data perception from removed to intimate. The format of narration becomes additional story layer.
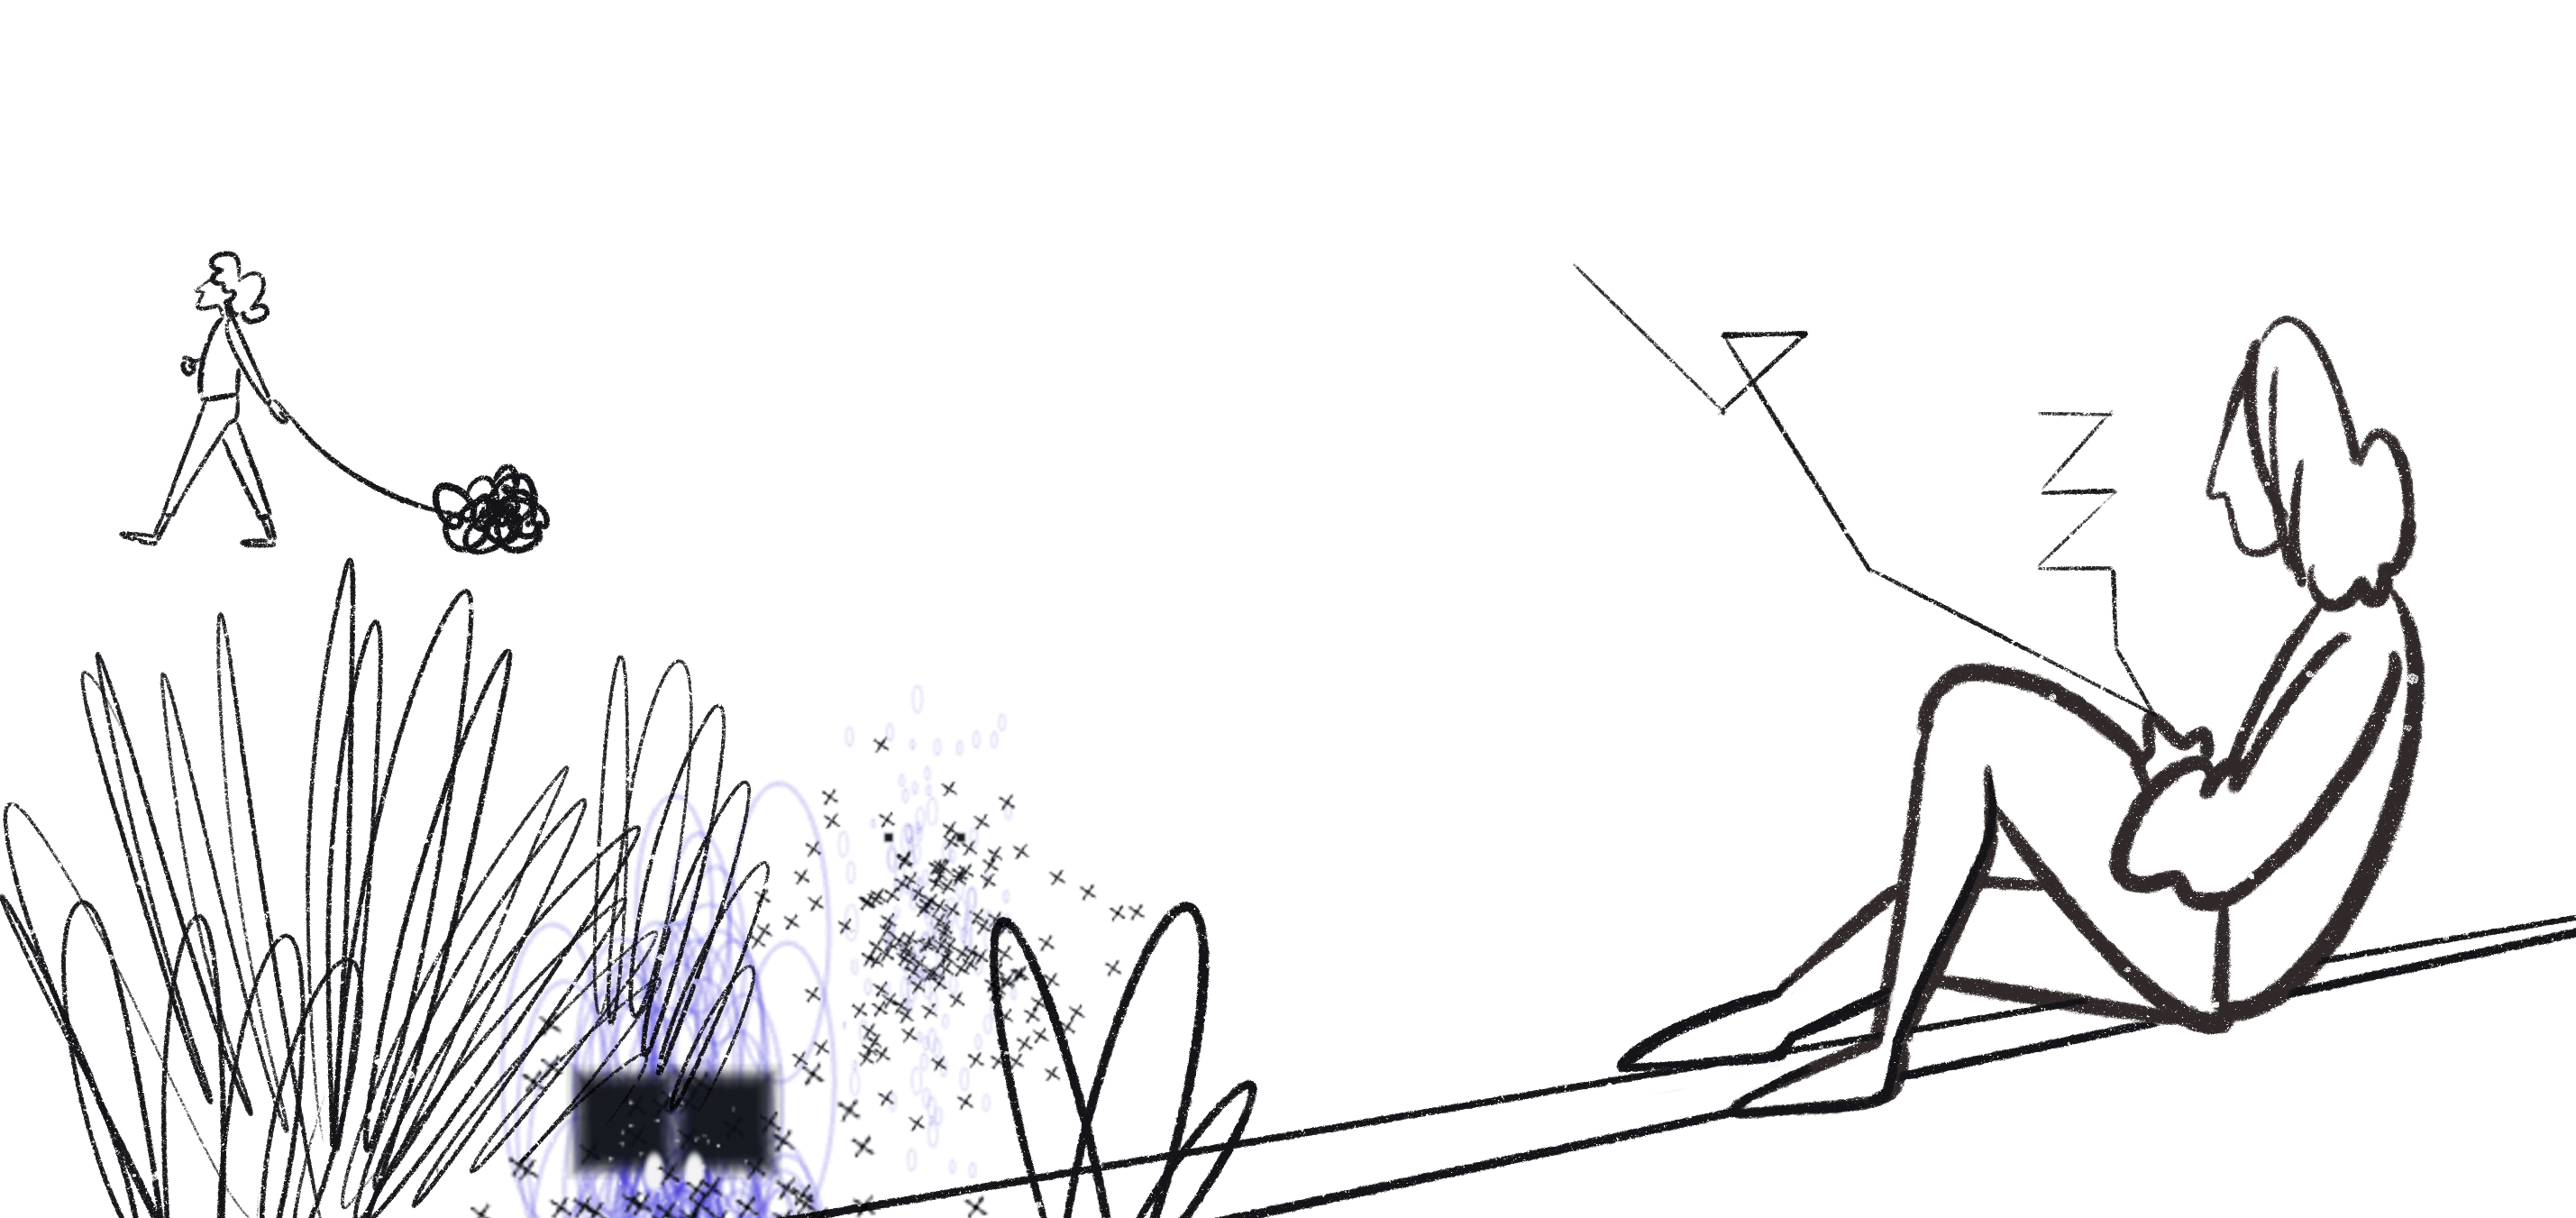
Sketching diary - data in personal space
Designers and makers work with data as a material that is weaved through the computing projects. However, an information set is already structured according to an ‘intent’, the initial question that has been asked prior to collecting it.4 What are the critical thinking tools that can be applied to unpack those pre-existing relations by practitioners that are not data scientists?
Aware of Daniela K Rosner critique of Design Thinking process as too narrow and simplistic8, I chose to stay in DT framework but alter it. My interest was in exploring the space where data enters the practice of building user journeys. I approached it as a separate actor in a parallel UCD-like process. In the same way we empathise with users, by considering their needs and wants, behaviours and society context; I constructed mapping canvas to ask similar questions about data set. If information can come with pre-embedded stories seeds, I wanted to acknowledge it in the multispecies storytelling approach and give it a presence that would invite an atmosphere of getting to know each other. My focus was not to tell story with data but to tell the story of data so that it can be evaluated and speculated with.
Anthropomorphising data as characters
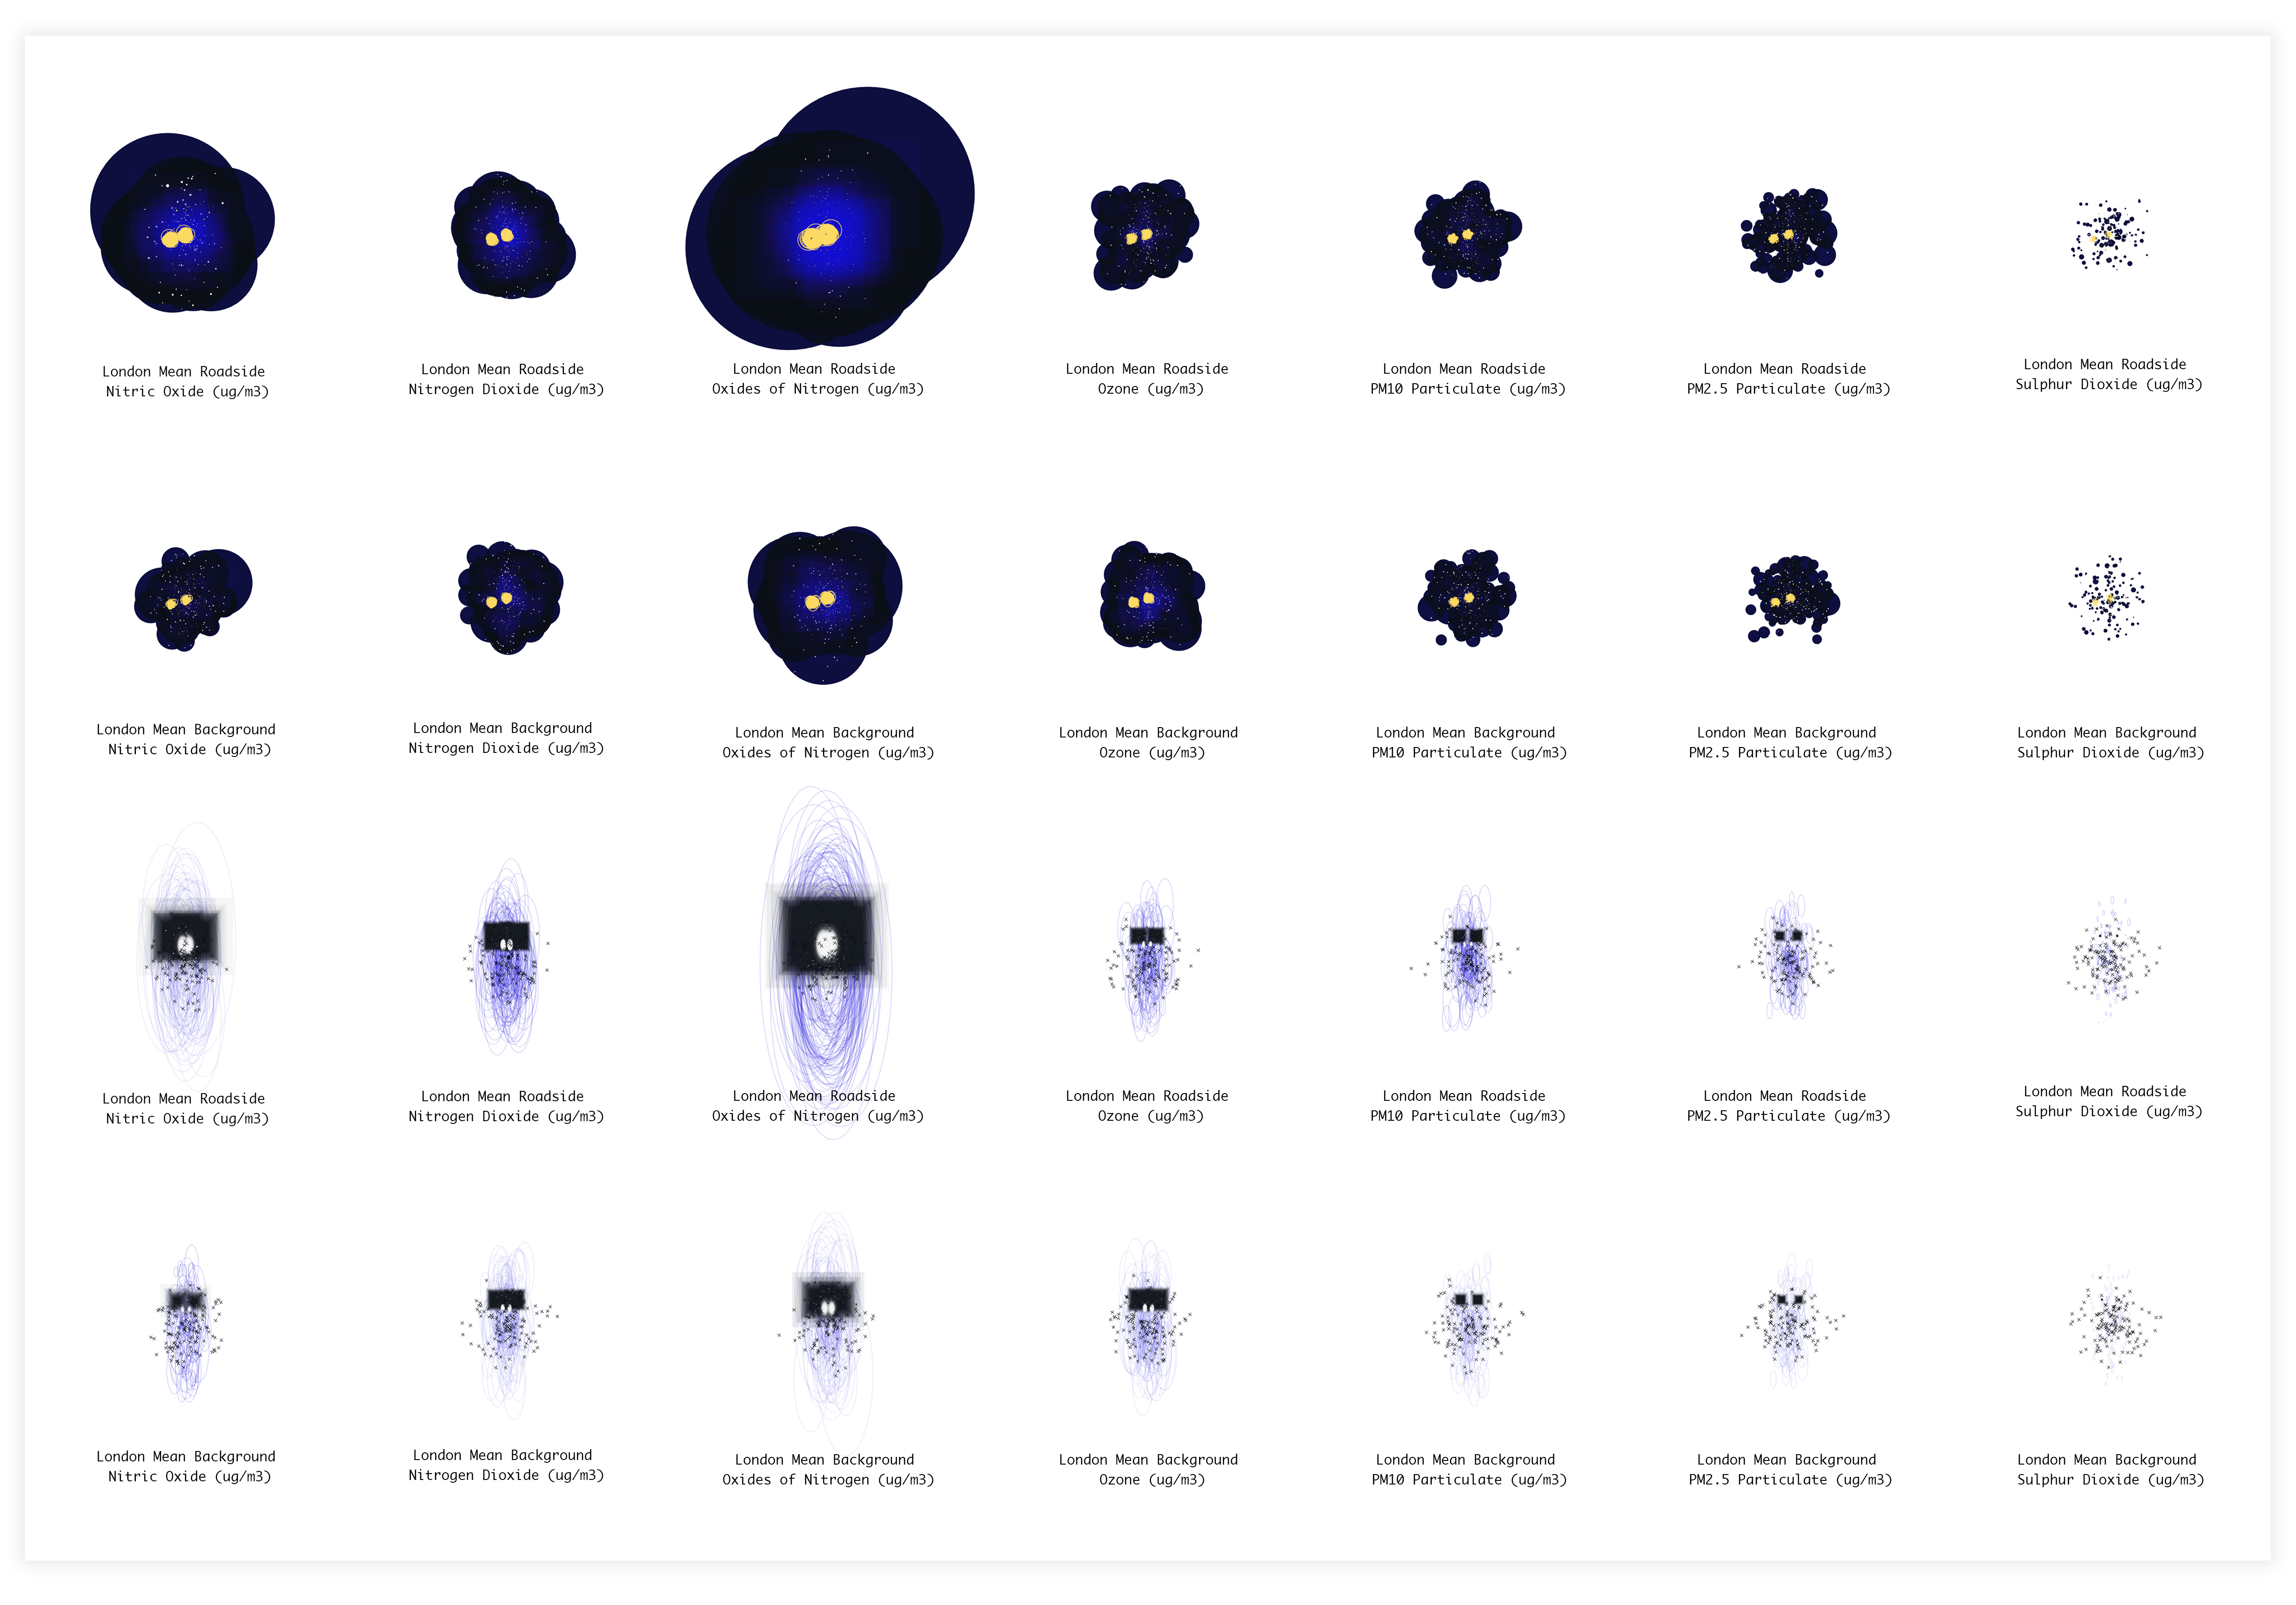
Generated characters in two 'suits'
For this exploration I chose publicly available dataset of Air pollution in London8. I created digital ‘body’, which properties manifest based on specific pollutant's data. Next, I swapped pollutants input to see how it changes the character’s expression. I repeated the process for two different ‘suit’ designs. Information emerged as a character-storyteller that augments the data from CSV file.
Unlike BOB, the AI based creature9, these characters do not have interactive behaviours or tasks to do. They are there to represent parts of the 'black box'. Adding implied emotive traits to data structures is data visualisation and arguably another layer or distortion, but perhaps one that invites interaction through familiarity. Characters usually have background story and personalities, so do tables of facts; the ‘web of relations’ described by Donna Harraway.10 In these characters multiple narrators work together to tell the story of a pollution in London: datasets creators, data structure itself, my input as a designer-coder and the constratints of coding environment I used to generate the graphics with.
References:
1. Hui Kyong Chung, W. Programmed Visions. Software and Memory, MIT Press, 2011
2. Niederer S., Taudin Chabot R. Deconstructing the cloud: Responses to Big Data phenomena from social sciences, humanities and the arts, Big Data & Society, 2015, Journal #2(2)
Retrieved from: https://journals.sagepub.com/doi/full/10.1177/2053951715594635 Accessed 4th May 2020
3. Le Guin, U. K. The Carrier Bag Theory of Fiction, 1996,
Retrieved from: https://www.academia.edu/17313163/The_Carrier_Bag_Theory_of_Fiction_-_Ursula_K._Le_Guin Accessed 4th May 2020
4. Veel K. Make data sign: The automation of storytelling, Big Data & Society, 2018, Journal # 5(1).
Retrieved from: https://journals.sagepub.com/doi/full/10.1177/2053951718756686 Accessed 4th May 2020
5. Vonnegut K. On the Shapes of Stories, Video lecture.
Retrieved from: https://www.youtube.com/watch?v=oP3c1h8v2ZQ Accessed 4th of May 2020
6. Lupi G. Posavec S.; Dear Data,
Retrieved from: http://www.dear-data.com/theproject Accessed 4th May 2020
7. K. Rosner, D. Critical Fabulations: Reworking the Methods and Margins of Design, MIT Press, 2018
8. London Ari Quality,
Retrieved from https://www.kaggle.com/zsn6034/london-air-quality Accessed 4th May 2020
9. Cheng, I. BOB: Bag of Beliefs,
Retrieved from: http://iancheng.com/BOB Accessed 4th May 2020
10. J. Harraway, D. Staying with the Trouble: Making Kin in the Chthulucene, Duke University Press, Durham and London 2016