


Particulate Matter 2.5
The biggest impact of particulate air pollution on public health is understood to be from long-term exposure to PM2.5. These are particles with an aerodynamic diameter smaller than 2.5 μm and are therefore small enough you enter inside the body. This project uses PM data from the internet to visulize a counties potentail health risk.
produced by: Jonny Fuller-Rowell
Introduction
PM2.5 are the most common form of pollutants triggering disease. This project visualizes the amount of PM2.5 in the atmosphere of different cities around the world. Using PM2.5 data from Airvisual.com the programme searchs for the PM2.5 value to use as a variable. Using microscopic images as a reference the programme creates a particle, it's size mapped to the amount of PM2.5 per cubic meter (m3) in a particular city. A 3D particle microscope allows the operator to inverstigate the particle by nagivating around it in 360 degrees and zooming in and out using the mouse. The more the particle fills the cube the higher the health risk.
Concept
Air quality visualizations using of this type of data tend to be in the form of a map incorporating specific colours and numbers to communicate the differing levels. I wanted to attempt to make this same data more tangible. By offering the user the ability to inspect on a microscopic level one particle, I hope to offer a more corporeal experience of the air quality data.
Technical
The particle itself it constructed using the ‘Collatz conjecture’. This is a conjecture in mathematics concerning a particular equation leading to sequences of numbers. It starts with any positive integer (n), each term is obtained from the previous term, if the previous term is even, the next term is half the previous term. If the previous term is odd, the next term is 3 times the previous term plus 1. The conjecture is that no matter what value of n, the sequence will always reach 1. This results in surprisingly organic forms. The programme uses sets of random numbers which feed into the collatz function whose numbers then feed into the particle function, which draws the particle. The particle is made up of 1500 lines each drawn depending on the sequence it receives and the particular variables given. The length of each segment of a line is varied by mapping the PM2.5 data from the website “airvisual.com”. Therefore if a country has hazardous air quality the particle will be very large filling the cube, used as a reference for one cubic meter (m3). There is also a colour scale ranging from good to hazardous to aid reference.
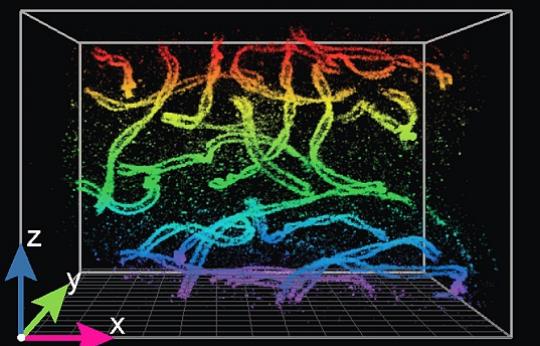
Visuals
I took visual inspiration for the PM2.5 particle from microscopic viruses. I wanted it to look solid but at the same time quite fragile to get the impression that it could be easily dissolved into someone’s blood stream. The 3D electron scanner aesthetic was taken from fluorescence nanoscopy (see images).
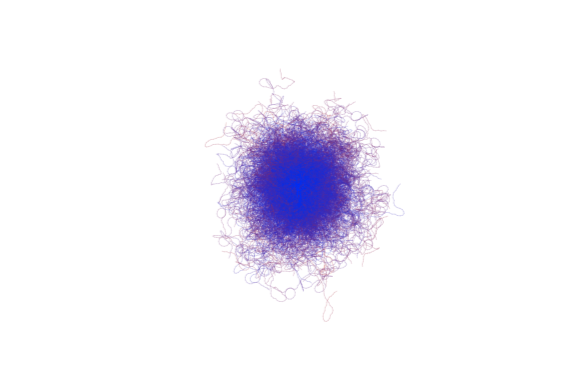
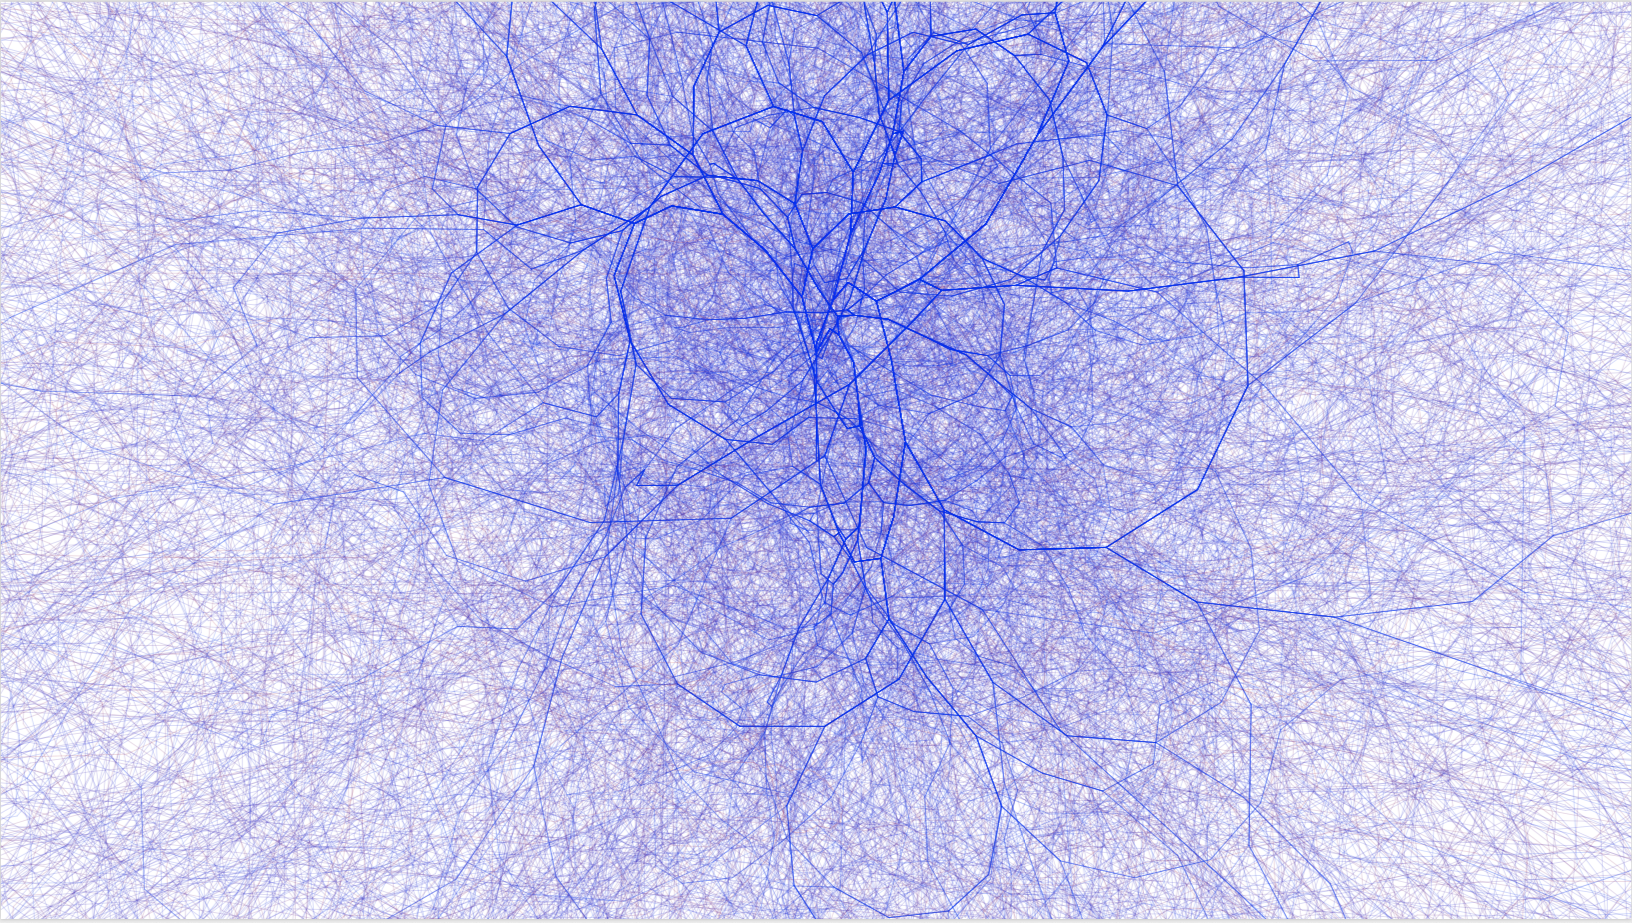
HD (1920*1080) Image of the final output
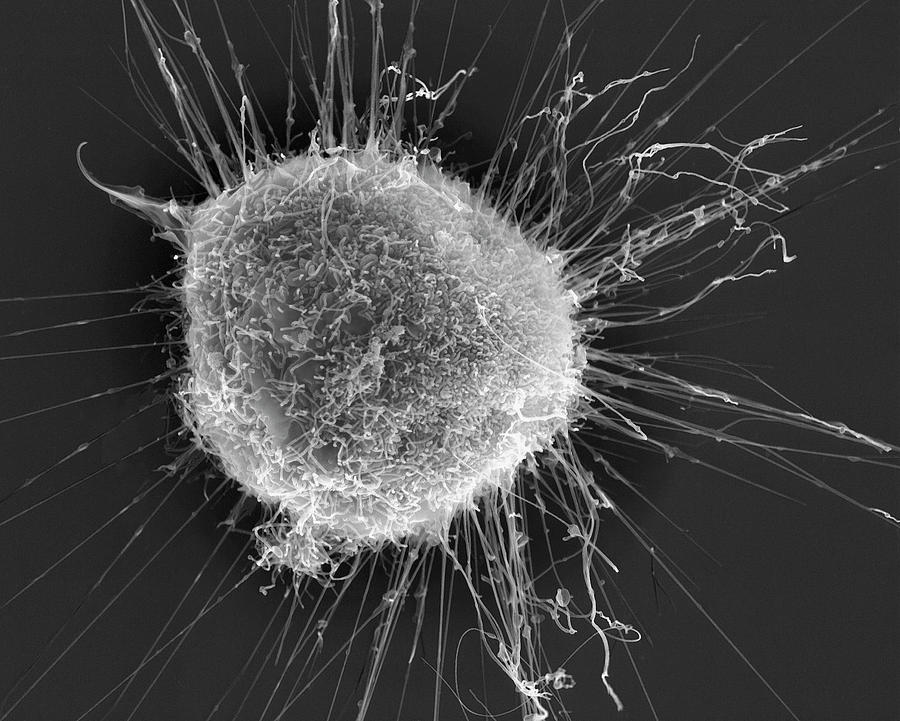
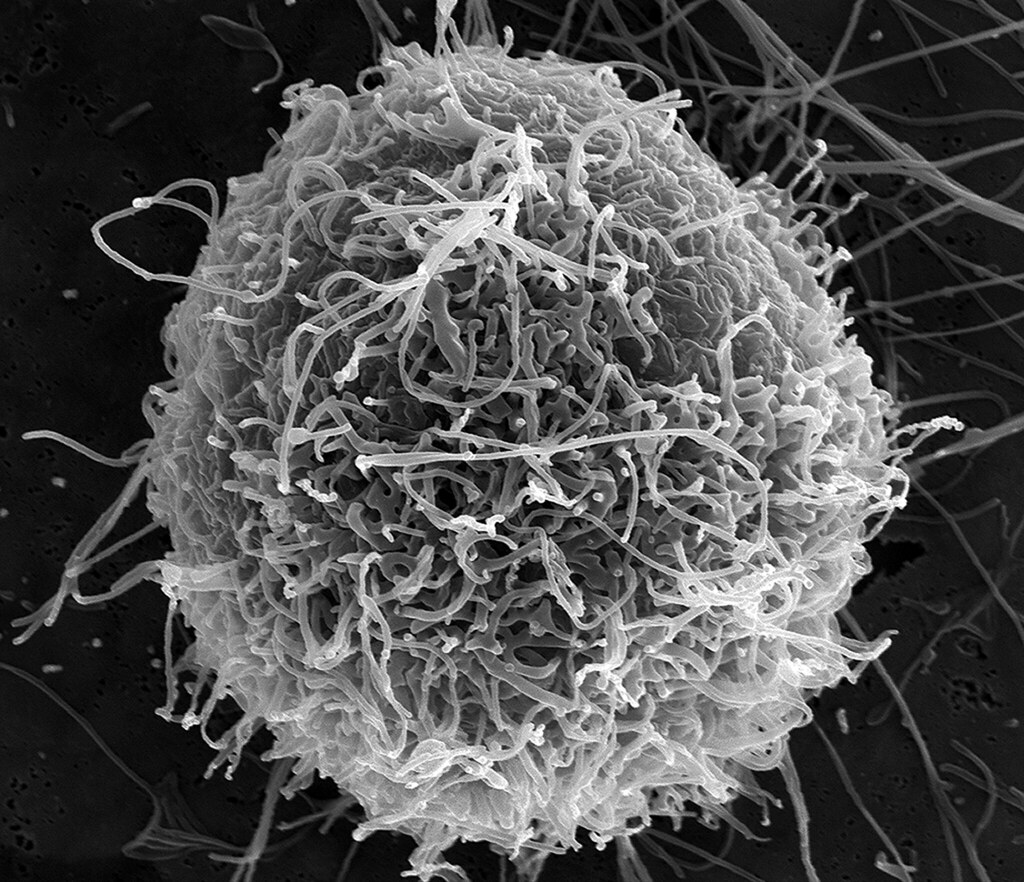
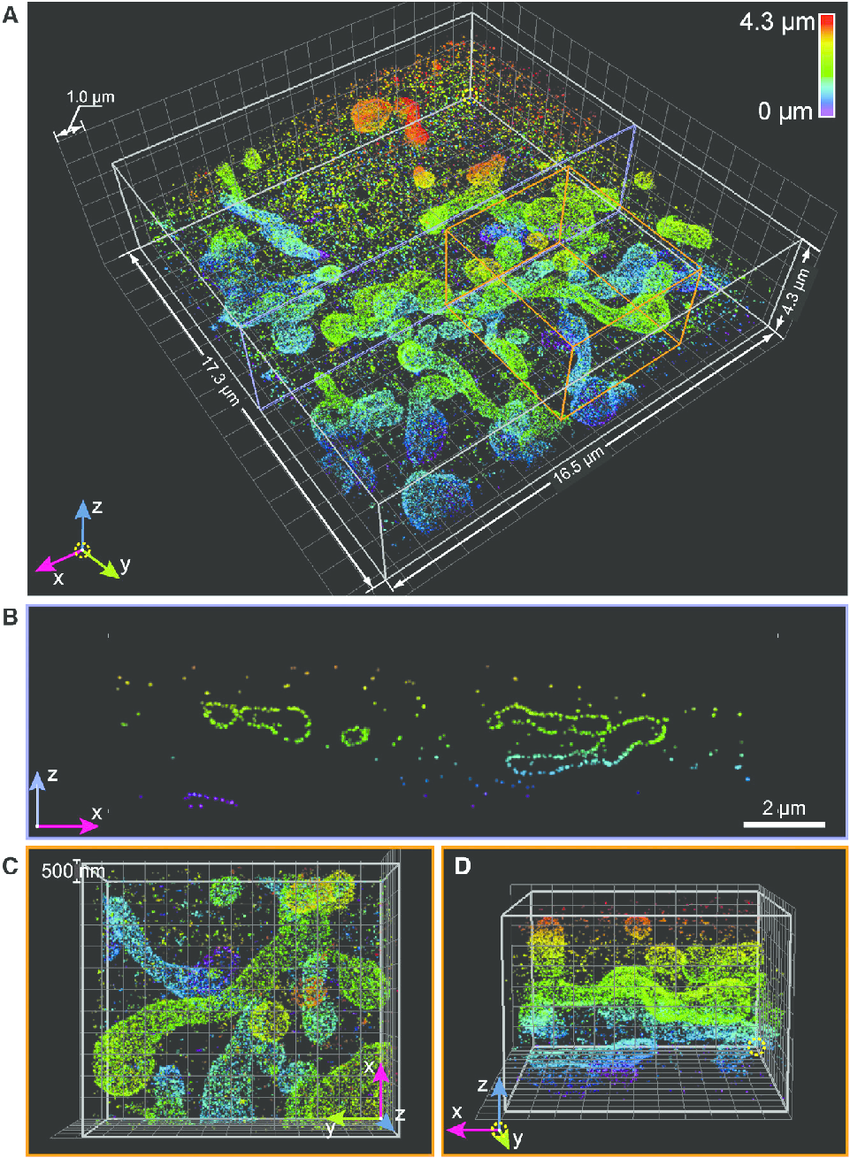
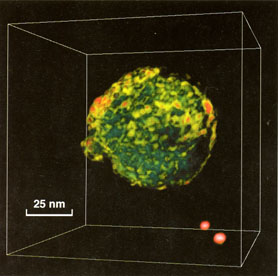
Reference images
References
Learning Processing: A Beginner's Guide to Programming Images, Animation, and Interaction : Daniel Shiffman : 2009
Coding in the Cabana 2: Collatz Conjecture : https://www.youtube.com/watch?v=EYLWxwo1Ed8 : Daniel Shiffman
Collatz Conjecture in Color - Numberphile : https://www.youtube.com/watch?v=LqKpkdRRLZw
Air quality and pollution city ranking : https://www.airvisual.com/world-air-quality-ranking
DEFRA public health: sources and effects of PM2.5 : https://laqm.defra.gov.uk/public-health/pm25.html
United States Environmental Protection Agency : https://www.epa.gov/pm-pollution/particulate-matter-pm-basics#effects